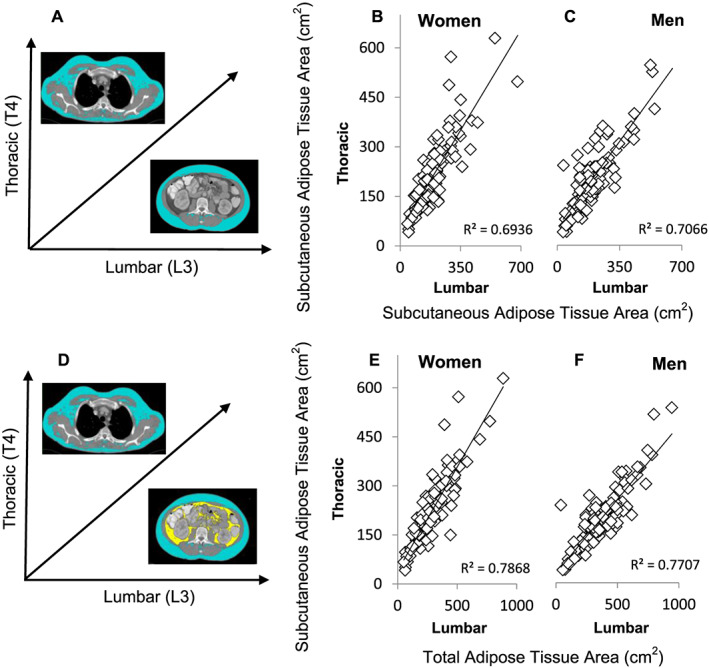
Figure 3.

T4 vs. L3 correlations for characteristics of adiposity (subcutaneous adipose tissue/total adipose tissue). Panel (A) illustrates the vertebral landmark and tissue on the axes of panels (B) and (C); panel (D) does the same for (E) and (F). Correlations were assessed between subcutaneous adipose tissue at two vertebral levels and of T4 subcutaneous adipose tissue vs. total adipose tissue at the L3 level, which consists additionally of visceral adipose tissue. Values are presented for male (n = 116; panels C/F, respectively) and female (n = 99; panels B/E, respectively) patients.
