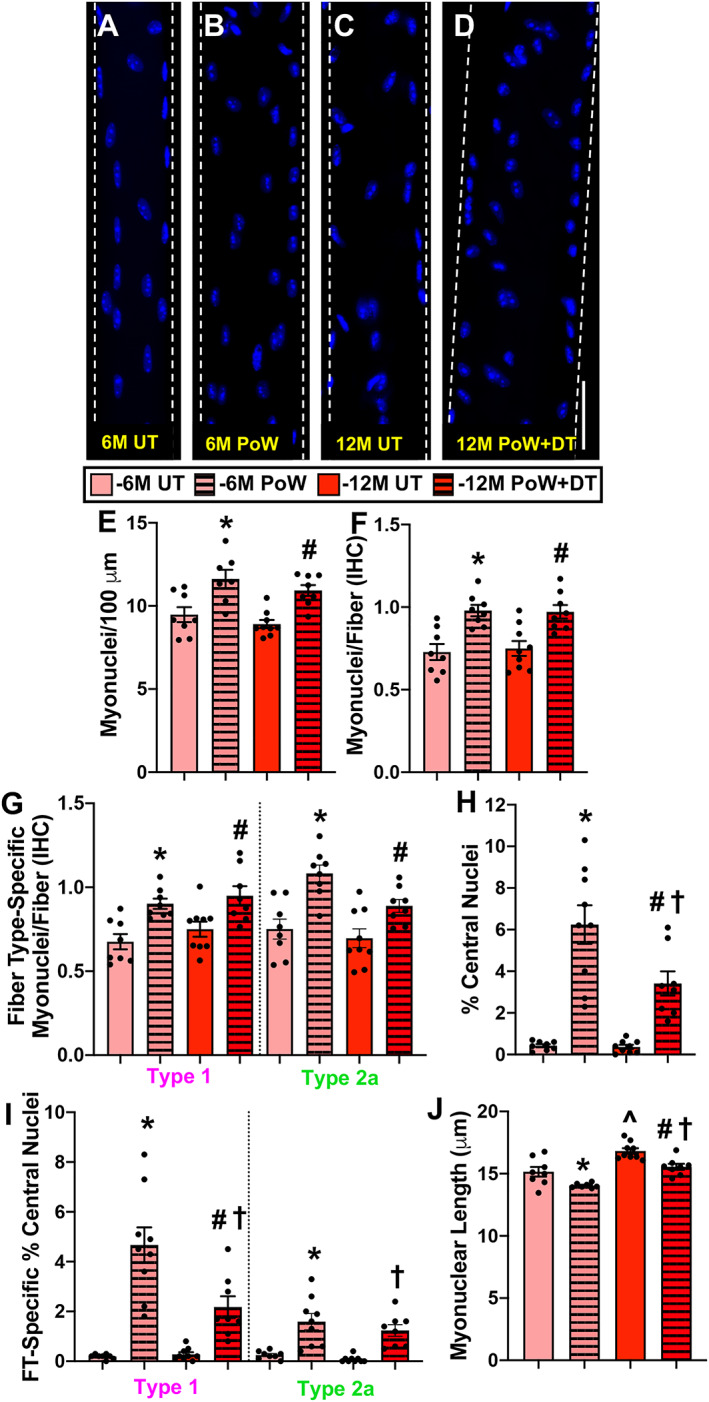
Figure 3.

Soleus myonuclear analysis with training and detraining. (A–D) Representative images of longitudinal single muscle fibres from 6M UT, 6M PoW, 12M UT, and 12M PoW + DT. (E) Single fibre analysis of myonuclear number. (F) Immunohistochemistry (IHC) analysis of myonuclear number. (G) Fibre type‐specific myonuclear number via IHC. (H) Proportion of fibres with central nuclei (CN). (I) Myonuclear length. *6M UT versus 6M PoW, ^6M UT versus 12M UT, #12M DT versus 12M PoW + DT, †6M PoW versus 12M PoW + DT. All P < 0.05, scale bars = 50 μm, n ≥ 7 per group for each analysis.
