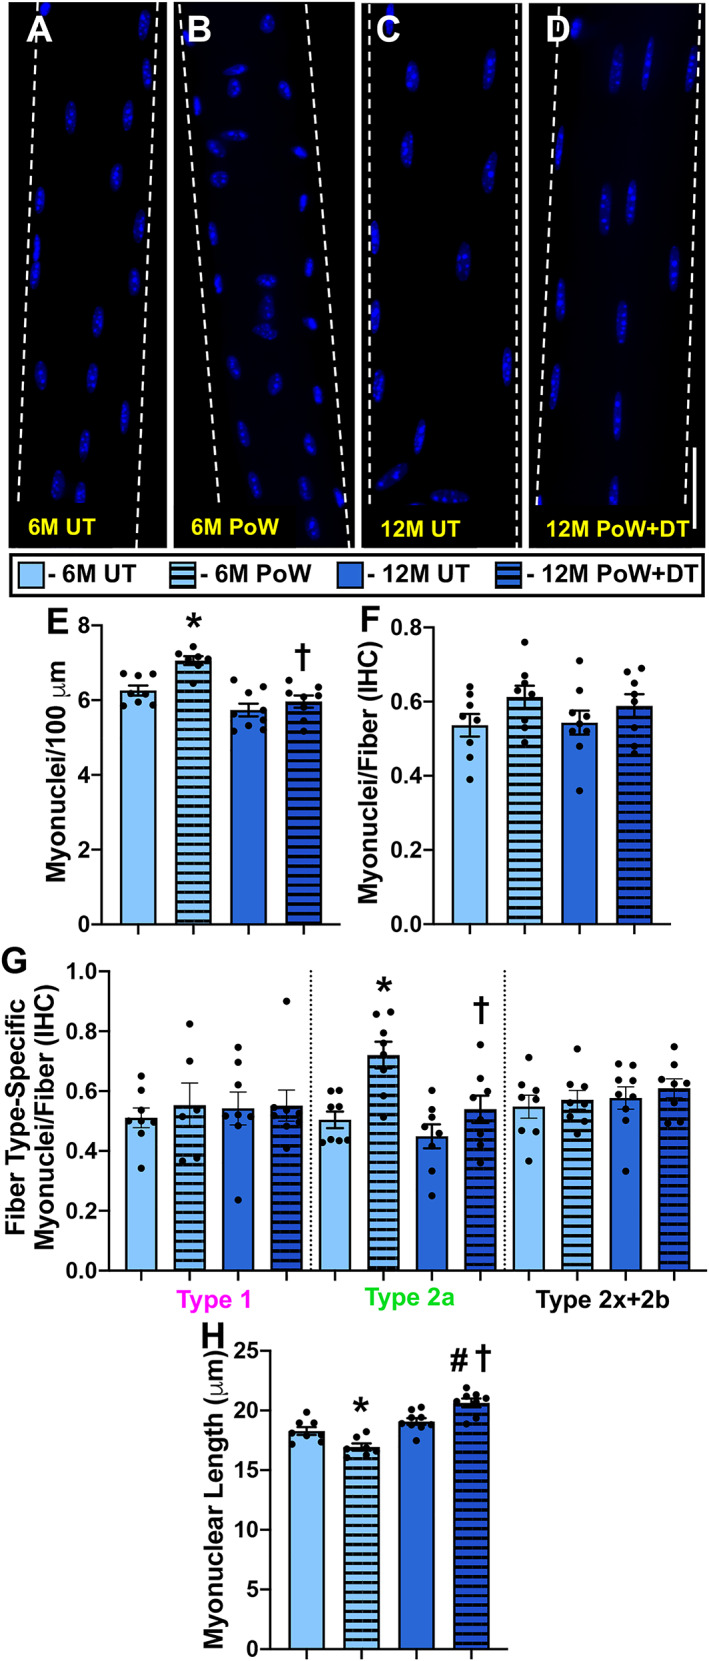
Figure 6.

Gastrocnemius myonuclear analysis with training and detraining. (A–D) Representative images of longitudinal single muscle fibres from 6M UT, 6M PoW, 12M UT, and 12M PoW + DT. (E) Single fibre analysis of myonuclear number. (F) Immunohistochemistry (IHC) analysis of myonuclear number. (G) Fibre type‐specific myonuclear number via IHC. (H) Myonuclear length. *6M UT versus 6M PoW, ^6M UT versus 12M UT, #12M DT versus 12M PoW + DT, †6M PoW versus 12M PoW + DT. All P < 0.05, scale bars = 50 μm, n ≥ 7 per group for each analysis.
