Figure 8.

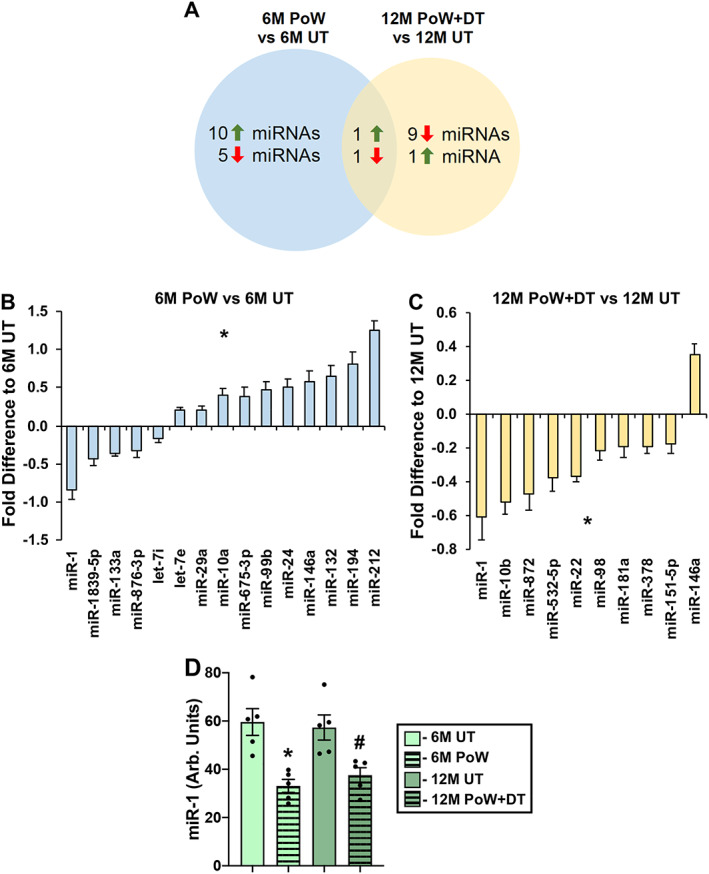
Quantitative analysis of miRNAs in gastrocnemius muscles with PoWeR training and detraining. (A) Venn diagram illustrating the number of miRNAs differentially regulated by PoWeR training (6M PoW versus untrained 6M UT), detraining (12M PoW + DT versus 12M UT), and differentially regulated miRNAs common to PoWeR trained and detrained. (B) Differentially regulated miRNAs in 6M PoW versus 6M UT, *P < 0.05. (C) Differentially regulated miRNAs in 12M PoW + DT versus 12M UT, *P < 0.05. (D) miR‐1 levels across all four groups, analysed via one‐way ANOVA. *P < 0.05 6M UT versus 6M PoW, # P < 0.05 12M DT versus 12M PoW + DT. n = 5 per time point.
