
FIGURE 1.
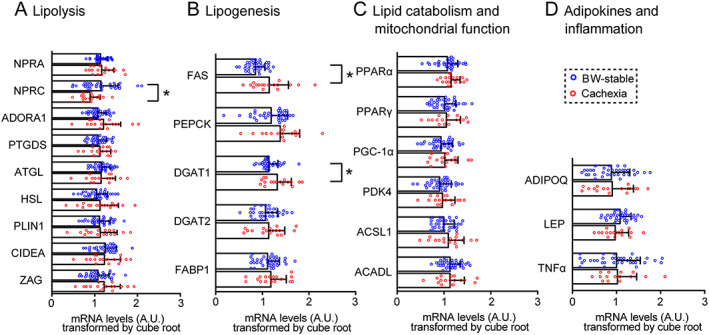
Expression of lipid metabolism, adipokines and inflammatory genes in epicardial adipose tissue. Comparison between body weight‐stable (n = 35) and cachectic (n = 17) patients. (A–D) Transcripts grouped according to their functions. Transcript levels (A.U.) were normalized (i) to geometric mean of three housekeeping genes and (ii) by cube root transformation. Data are means ± SE; Student's t‐test. *Significant difference between the groups; for fold‐change of the means, see Table S2. For gene names abbreviations, see the main text and Table S1.