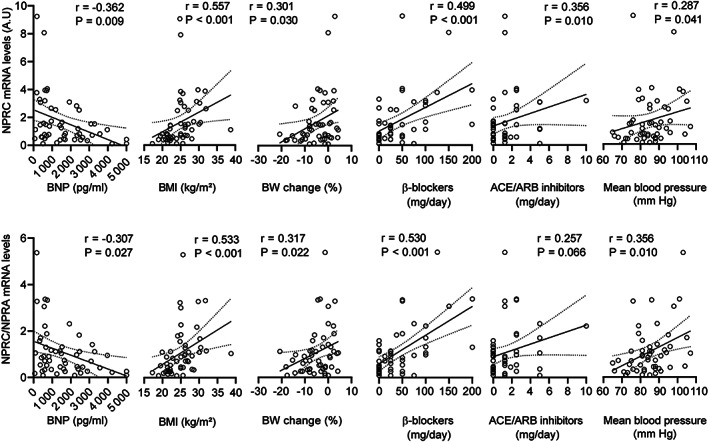
FIGURE 2.

Correlation of gene expression markers of natriuretic peptide system activity with clinical parameters. Linear regression plot of the relationship between transcript levels of NPRC (upper panels), or the ratio between NPRC and NPRA transcript levels (NPRC/NPRA; lower panels), and the indicated parameters. Linear regression lines, including 95% confidence intervals, are shown. Spearman's rank correlation coefficients (r) and P value (indicated in the figures) were also calculated to assess the correlations between various parameters. For the source data, see Figure 1 and Tables S1, 1, and 2. ACE/ARB inhibitors, angiotensin‐converting enzyme inhibitors/angiotensin receptor blockers; BNP, natriuretic peptides B; BMI, body mass index; BW, body weight; NPRC, natriuretic peptide receptor C
