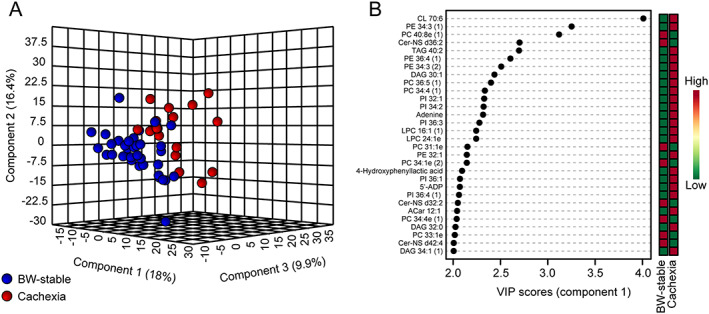
FIGURE 4.

Multivariate analysis of epicardial adipose tissue (EAT) metabolome. Untargeted metabolomic and lipidomic analysis was performed using EAT extracts in all patients (n = 52) as described in Method S1. Dataset of all analytes with known structure detected in EAT (Figure S1), except for drugs and other non‐physiological analytes ( Table S3), was analysed using partial least squares discriminant analysis. (A) Score plot resulting from the analysis focused on the separation between the body weight (BW)‐stable (n = 35) and cachectic (n = 17) patients (Table 1). (B) The corresponding variable importance in projection (VIP) plot with scores, to identify the top 30 most discriminating analytes. The coloured boxes indicate the relative concentrations of the corresponding analyte in each group; for fold‐change, see Dataset S2A. 5'‐ADP, adenosine‐5'‐diphosphate; Cer‐NS, ceramide non‐hydroxyfatty acid‐sphingosine; CL, cardiolipin; DAG, diacylglycerol; LPC, lysophosphatidylcholine; LPE, lysophosphatidylethanolamine; PC, phosphatidylcholine; PE, phosphatidylethanolamine; PG, phosphatidylglycerol; PI, phospatidylinositol; TAG, triacylglycerol. Lipid class x : y, acyl number of carbons : number of double bonds. Number in the brackets, isobar of the analyte.
