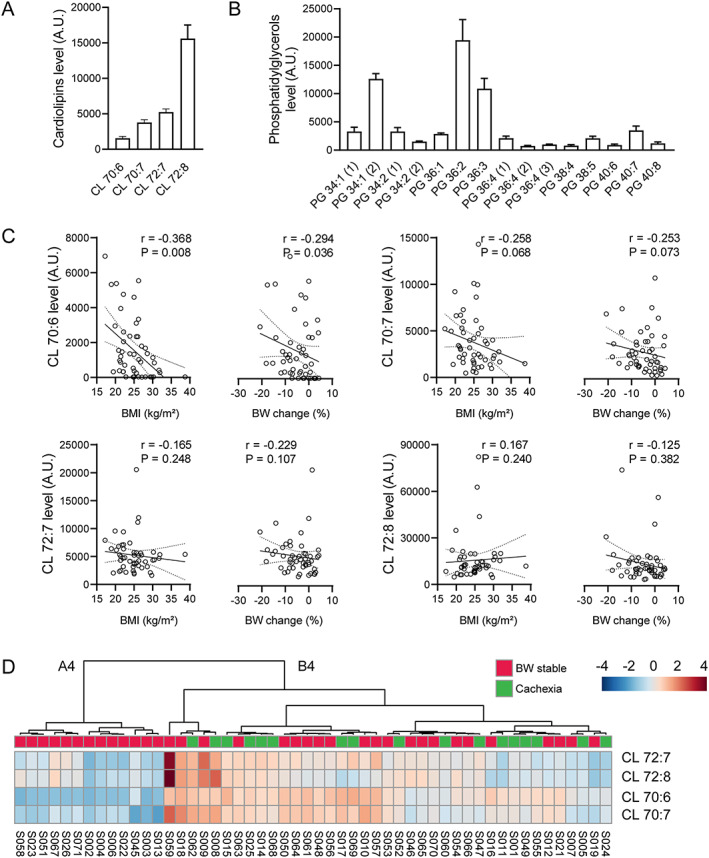
FIGURE 5.

Involvement of cardiolipins (CLs) and phosphatidylglycerols (PGs) in epicardial adipose tissue (EAT) in cachexia. (A and B) Relative levels of various CLs and PGs in EAT; for the source data and further data analysis, see Dataset S1 and Table S4; data are means ± SE. (C) Linear regression plot of the relationship between (i) BMI and (ii) BW change during previous 6 months and EAT levels of various CLs. Linear regression lines, including 95% confidence intervals, are shown. Spearman's rank correlation coefficients (r) and P values (indicated in the figures) were also calculated to assess the correlations between various parameters. For the source data, see Table 1 and Dataset S1 and Table S4 . (D) Hierarchical clustering of four CLs detected in EAT. Heatmap showing data for all patients (n = 52). Heatmap was generated using Euclidean for distance measure and Ward for clustering algorithm. For more information about CLs, see Table S4. Each column represents a patient and each row represents the expression profile of an analyte across patients. BW‐stable and cachectic patients (Table 1) are indicated. A4 and B4, designation of two clusters separated at the first level of hierarchy.
