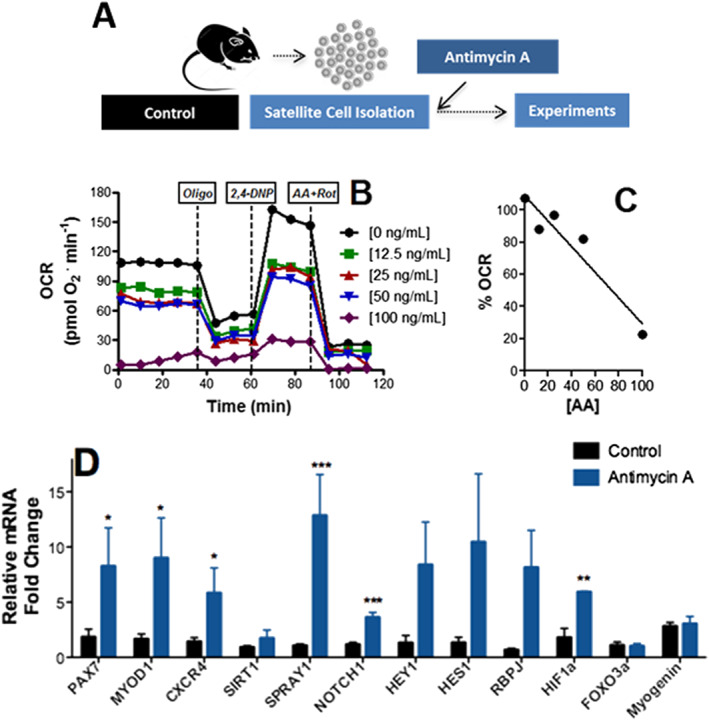
Figure 7.

Inhibition of mitochondrial O2 consumption promotes satellite cell self‐renewal. (A) Schematic panel. (B) Typical oxygen consumption rate (OCR) trace in the presence of different concentrations of antimycin A. (B and C) Respiratory inhibition vs. antimycin A concentrations. (D) Satellite cell expression profile after 8 h in the presence of 70 ng/mL antimycin A (n = 8, control; n = 4, antimycin A), relative to HPRT. Asterisks denote statistically significant differences (* P < 0.05, ** P < 0.01, and *** P < 0.001) vs. control.
