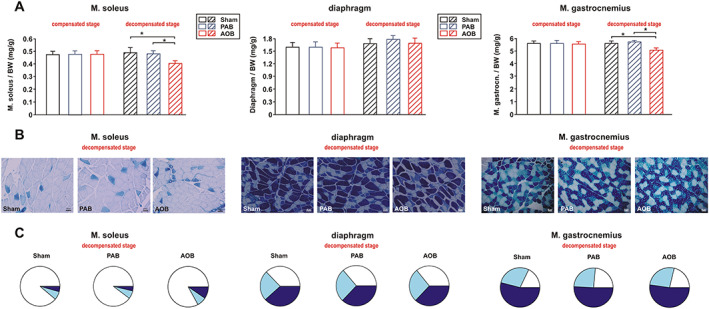
Figure 2.

Muscle weights (sarcopenia index) and muscle fibre types. (A) Differences in the weight of soleus muscle, diaphragm, and gastrocnemius muscle normalized per body weight (BW) in sham animals, ascending aortic banding (AOB) animals, and pulmonary artery banding (PAB) animals 7 weeks after surgery (compensated stage) or 22/26 weeks after surgery (decompensated stage). All data are mean ± standard error of the mean. n = 10–14 animals per group. * P < 0.05. (B) Representative results from ATPase staining in soleus muscle, diaphragm, and gastrocnemius muscle to distinguish between type I fibres (white), type IIA fibres (light blue), and type IIB fibres (dark blue). The size bar indicates 50 μm. (C) Analysis of the percentage of the according fibre types at the decompensated stage depicted as a pie chart. n = 6 animals per group.
