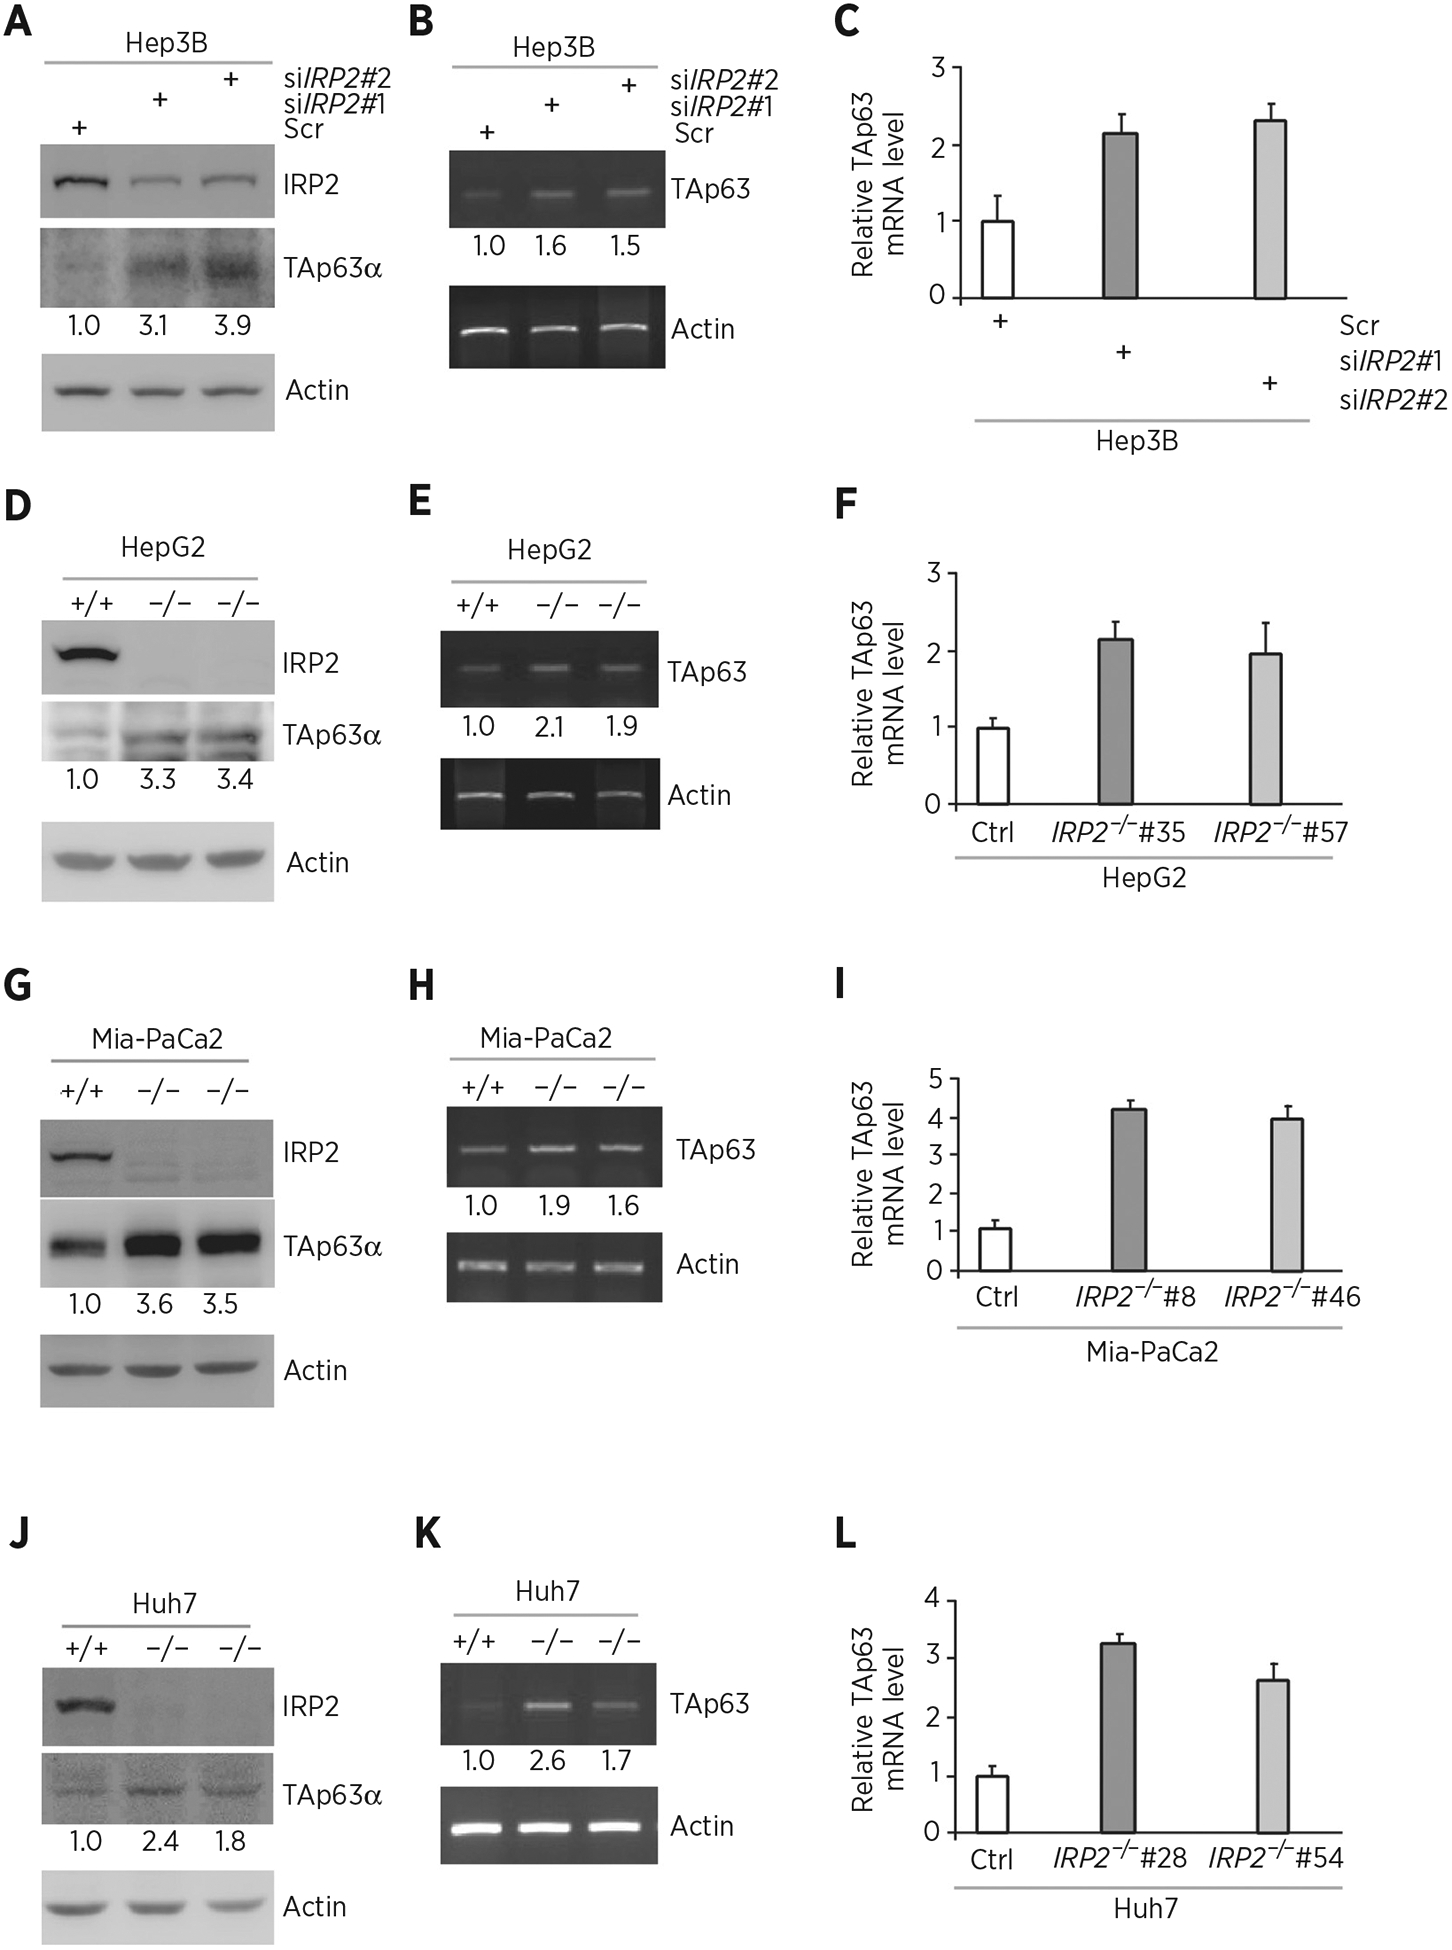
Figure 2.

Knockdown or knockout of IRP2 increases p63 expression. A, Hep3B cells were transfected with scrambled siRNA (Scr) or siRNA against IRP2 for 72 hours. Cell lysates were collected and subjected to Western blot analysis with various antibodies as indicated. The level of proteins was normalized to that of actin, and the relative fold change is shown below each lane. B, The levels of TAp63 and actin transcripts were measured in Hep3B cells transfected with scrambled siRNA or siRNA against IRP2 for 72 hours. The level of transcripts was normalized to that of actin, and the relative fold change is shown below each lane. C, Quantitative RT-PCR was performed to measure the levels of TAp63 transcripts in Hep3B cells transfected with scrambled siRNA or siRNA against IRP2 for 72 hours. D, Western blots were prepared with lysates from isogenic control or IRP2−/− HepG2 cells, and then probed with antibodies against IRP2, TAp63α, and actin, respectively. The level of proteins was normalized to that of actin, and the relative fold change is shown below each lane. E, The levels of TAp63 and actin transcripts were measured in isogenic control or IRP2−/− HepG2 cells. The level of transcripts was normalized to that of actin, and the relative fold change is shown below each lane. F, Quantitative RT-PCR was performed to measure the levels of TAp63 transcripts in isogenic control or IRP2−/− HepG2 cells. G–I, The experiments were performed as in D–F except that isogenic control or IRP2−/− MIA-PaCa2 cells were used. J–L, The experiments were performed as in D–F except that isogenic control or IRP2−/− Huh7 cells were used.
