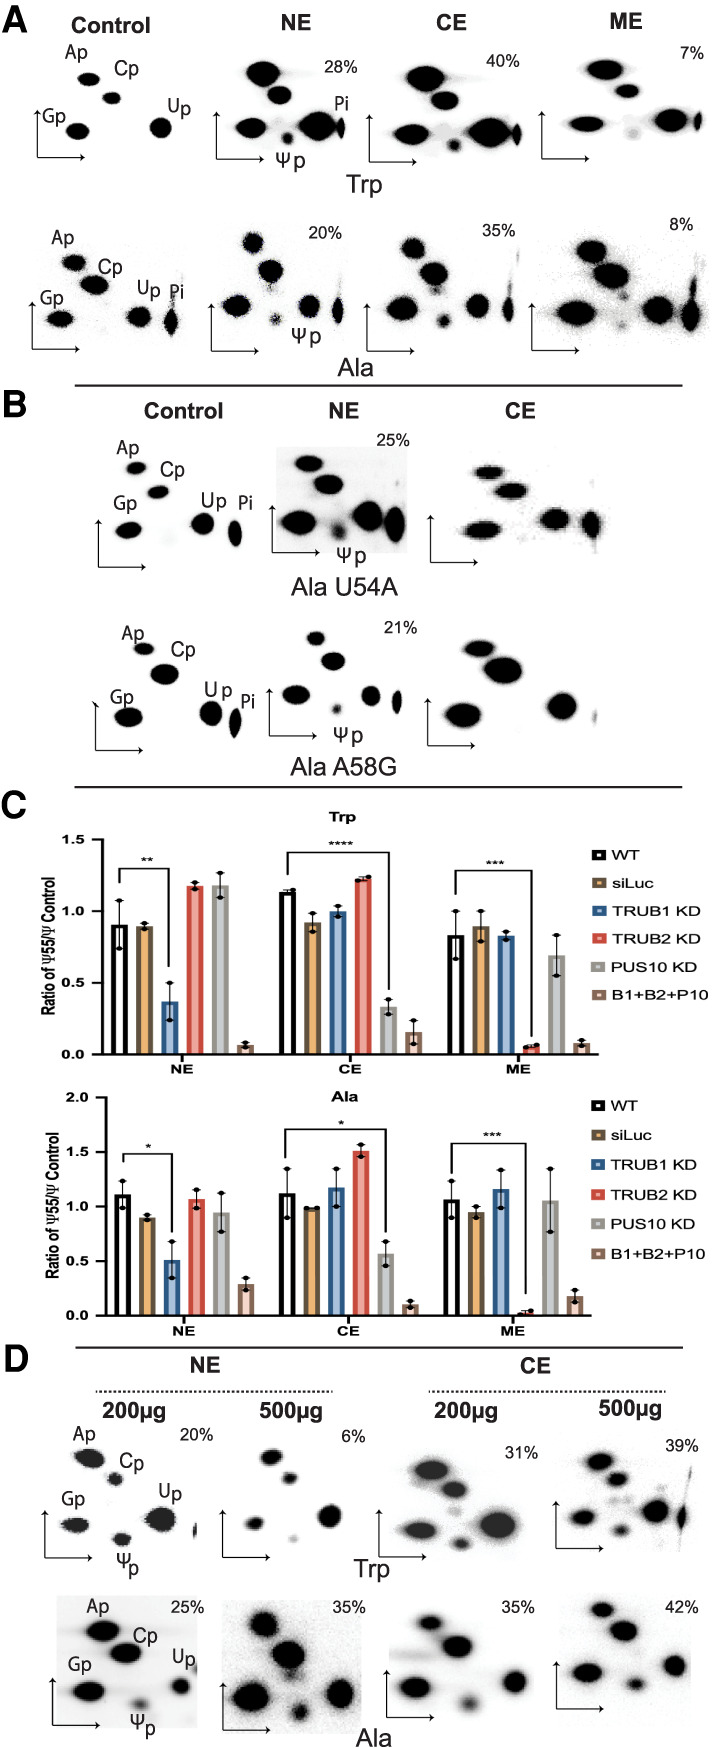
FIGURE 2.

The tRNA Ψ55 synthase activities of TRUB1, PUS10, and TRUB2 are mainly in the nucleus, cytoplasm, and mitochondria, respectively. (A) 2D-TLC analyses, as in Figure 1, after treating [α-32P]CTP-labeled tRNATrp and tRNAAla with nuclear (NE), cytoplasmic (CE), and mitochondrial (ME) extracts of PC3 cells. (B) 2D-TLC analyses after treatment of U54A and A58G mutants of tRNAAla with NE and CE. (C) Ratio of Ψ55 synthesis in tRNATrp and tRNAAla versus control Ψ synthesis by NE, ME, and CE of PC3 strains individually knocked down (KD) for TRUB1, TRUB2, and PUS10 and all three together (B1 + B2 + P10). Untreated (WT) and luciferase siRNA-treated (siLuc) PC3 cells were used as controls. Control Ψ synthesis by the NE and ME were PUS1- and PUS2-mediated Ψ27 synthesis in tRNAPhe and by the CE was tRNA Ψ31 synthase-mediated Ψ31 synthesis in a mutant tRNAMet, as described in the Supplemental Methods and Supplemental Figure S2. Values are represented as mean ± SE. n = 2 replicates using independently prepared extracts. Each replicate is presented as a scattered dot (filled circle). ANOVA with Sidak's Multiple comparison test with respect to the WT was performed and significant P values for single KDs are presented as (*) P < 0.05, (**) P < 0.01, (***) P < 0.001, and (****) P < 0.0001. P values of all comparisons are shown in Supplemental Table S1. (D) 2D-TLC analyses, as in A, after treating [α-32P]CTP-labeled tRNATrp and tRNAAla with 200 and 500 µg of NE and CE.
