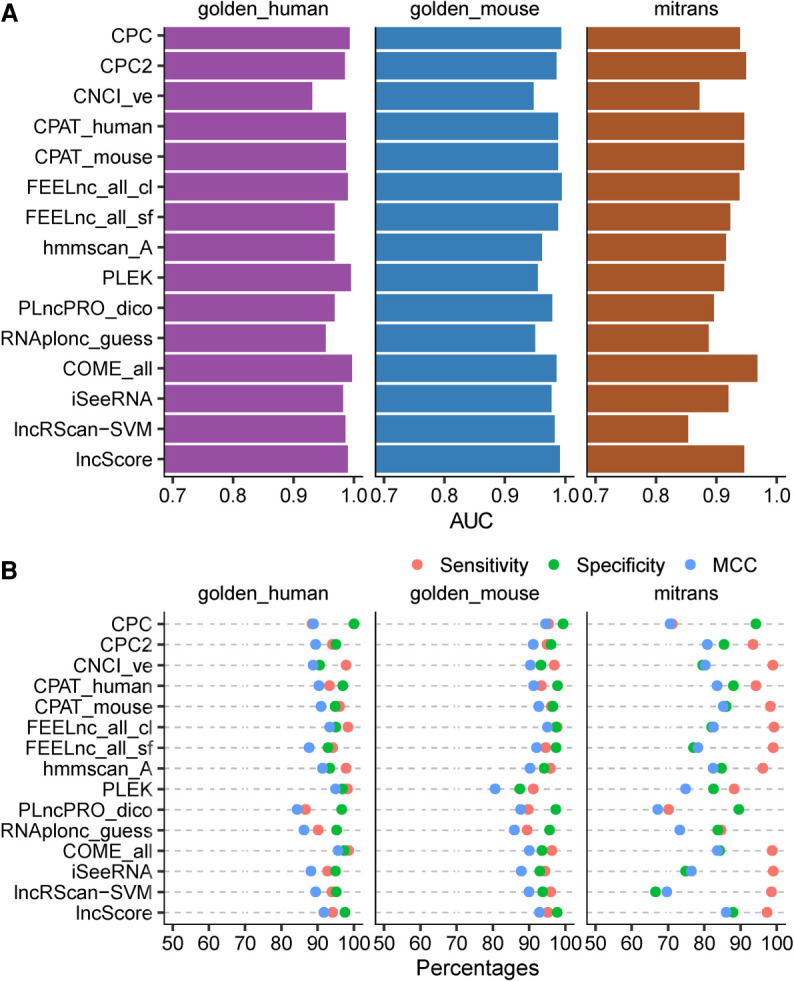
FIGURE 1.

The performance of representative models on golden_human, golden_mouse, and mitrans. The representative models are a subset of the models that have been tested (see Materials and Methods). (A) AUC value of ROC curve for each model on golden_human (purple), golden_mouse (blue), and mitrans (brown). (B) Sensitivity (red), Specificity (green), and Matthews correlation coefficient (MCC, blue) values for each model on the testing data. Sensitivity indicates the proportion of true classified positive samples (lncRNAs) on the total input positive samples (in percentage). Specificity indicates the proportion of true classified negative samples (mRNAs) on the total input negative samples (in percentage). MCC indicates the overall performance ranges from −100 to 100 (in percentage), where 100 implies a perfect prediction, 0 implies a random prediction, and −100 implies a totally wrong prediction.
