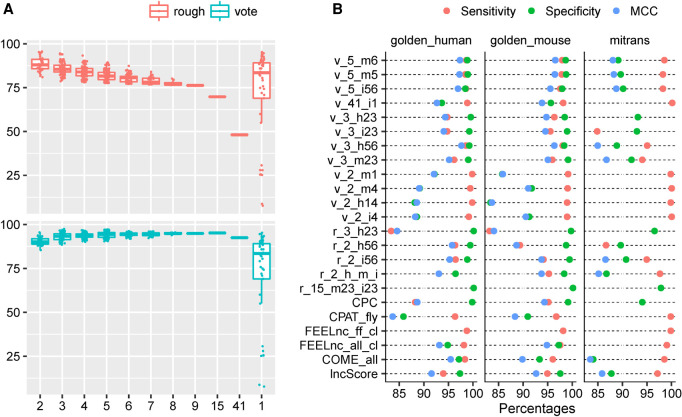
FIGURE 3.
Summary of joint predictions. (A) The MCC of joint predictions with different number of models on the golden_human data. The combination methods (“rough” and “voting”) were described in the “Materials and Methods” section. (B) Comparison of optimal joint predictions and optimal single models on three data sets (golden_human, golden_mouse, and mitrans). The optimal model is defined as one joint/single prediction performed best in terms of any metric of Sensitivity, Specificity, positive predictive value (PPV), negative predictive value (NPV), Accuracy, and MCC on any data set. The names of joint prediction follow this rule: (combination method, v for vote and r for rough)_(the number of models was used in combination)_(descriptions, where characters represent data sets: h for golden_human, m for golden_mouse, and i for mitrans; numbers 1–6 represent Sensitivity, Specificity, PPV, NPV, Accuracy, and MCC, respectively). For example, r_15_m23_i23 means 15 models were combined in the joint prediction following the rough rule, and this prediction showed the best Specificity and PPV on golden_mouse data as well as on mitrans data. Particularly, r_2_h_m_i is the abbreviation of r_2_h14_m1456_i14, which was a two-model joint prediction that has best Sensitivity and NPV on golden_human; Sensitivity, NPV, Accuracy, and MCC on golden_mouse; Sensitivity and NPV on mitrans. The complete list of models used in combination was recorded in Supplemental Table S15.

