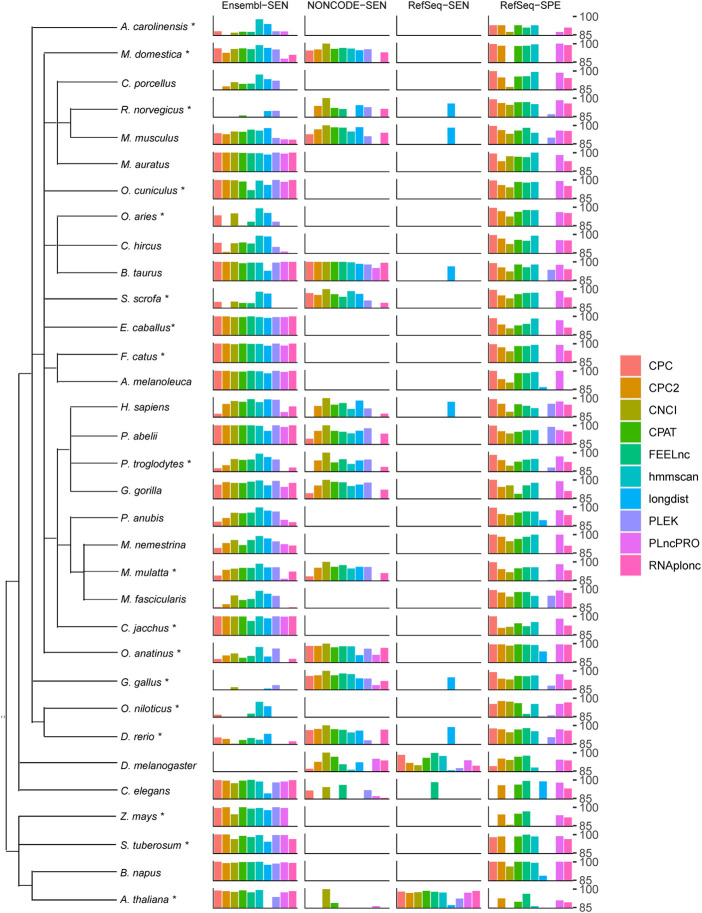
FIGURE 4.
Performance on multiple species (in percentage). The tree on the left depicts the taxonomy of the species involved, regardless of the evolutionary distance. The sampling procedure for core species (labeled with *) and peripheral species is described in the “Materials and Methods” section. For each species, this plot displays the optimal model with regard to the four metrics: Sensitivity on Ensembl, NONCODE, RefSeq, and Specificity on RefSeq. The best prediction for multiple-model software is shown.

