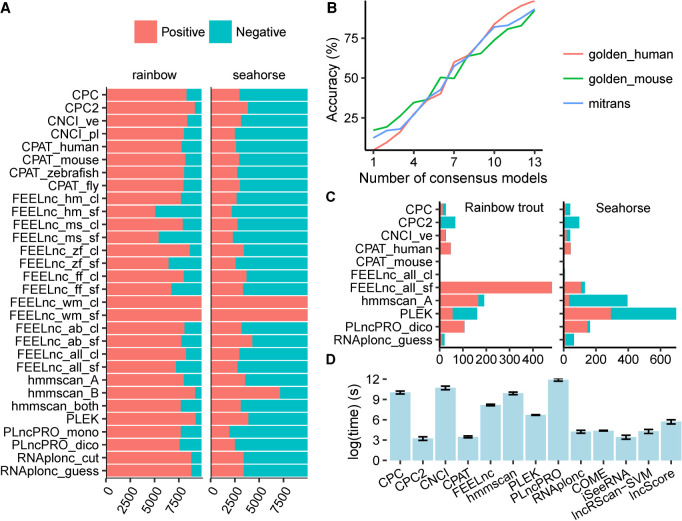
FIGURE 5.
Performance on real data and time efficiency. (A) Prediction bias. This figure shows the counts of positive (red) and negative (blue) results predicted by each model in addition to the longdist-based models. (B) The relationship between Accuracy and the count of models that give consensus predictions. Representative models were used in this analysis. (C) The counts of positive and negative disagreed-predictions on rainbow trout (left) and seahorse (right), respectively. The transcripts that were reported positive by one model while negative by other representative models were regarded as positive disagreed-predictions and vice versa. (D) Average time consumption of each software tool for predicting 5000 transcripts on golden_human, golden_mouse, and mitrans. The error bar shows the 95% confidence interval of Gaussian distribution.

