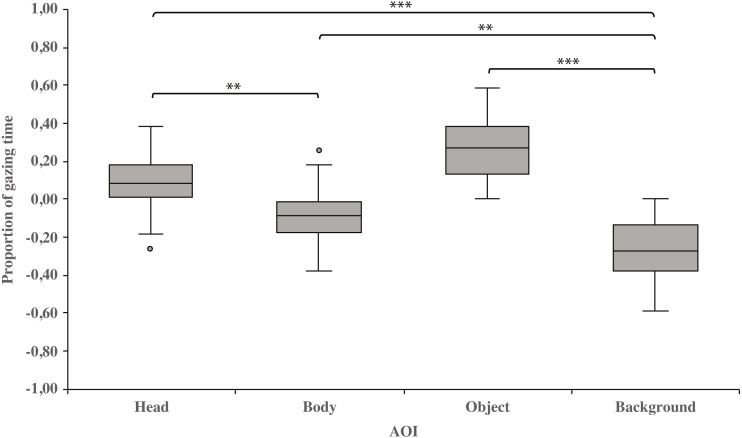
Figure 2. Gazing times of head, body, object and background areas of the images in both dog groups.
The mean differences in proportional gazing times of head, body, object and background areas of the images in both dog groups. The mean is shown by a line inside the box and whiskers show the minimum and maximum values of the data. Proportional AOI area gazing times were calculated by subtracting the relative AOI size (e.g., the size of the object divided by the size of the whole image) from the relative gaze time (the total gaze time of the object divided by the total gaze time of the whole image area). Statistically significant differences are represented by asterisks (∗∗∗p < 0.001 and ∗∗p < 0.01).

