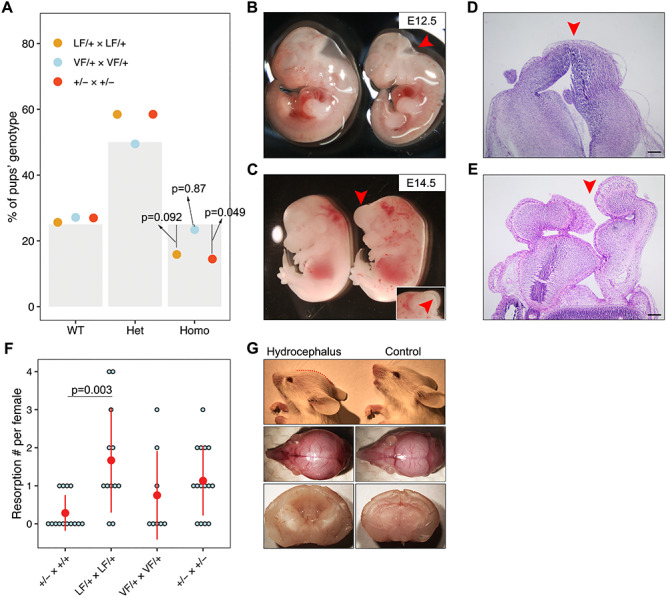
Figure 5.

Rabl2 mutant mice have distinct neural defects. (A) Proportion of WT, heterozygous and homologous offspring obtained from het × het intercrosses. The grey bars represent the expected ratios, 25% for WT and homologous and 50% for heterozygous. The dots represent the observed ratios. n = 195 offspring obtained from LF/+ intercrosses, n = 188 offspring obtained from VF/+ intercrosses and n = 200 offspring obtained from +/− intercrosses. (B) General observation images of hypoplastic head phenotype (labeled by red arrowhead) at E12.5 in LF/LF embryo (right panel) as compared with WT control (left panel). (C) Exencephaly (labeled by red arrowhead) in LF/LF (LF = Rabl2L119F) embryo as compared to WT control (left panel) at E14.5. The insertion represents the other side showing the opened head. (D) Histology of head for control mouse. (E) Cranial histology of mouse with NTD. Red arrowheads in D and E indicate closed and opened head, respectively. (F) Plot of the number of embryo resorptions per female at E16.5–E18.5 from a heterozygous breeding pair. (G) Representative lateral images of 2-week-old LF/LF mouse with a domed cranial vault (red dashed line) compared with WT mouse (upper panel). The middle panel shows the top view of the whole skulls from the same mice. Sagittal sections of brains (lower panel) from a LF/LF and WT mouse revealing dilatation of the lateral and third ventricles in the mutant brain. Data in A were analyzed using chi-square test. Data in F are represented as the mean ± SEM and were analyzed using one-way ANOVA with Tukey’s post hoc test. Scale bars in D and E represent 200 μm.
