
Fig. 2. Fiducial-based AO correction enables super-resolution imaging at depths exceeding 100 μm, as revealed by cytoskeletal imaging in fixed cells embedded in collagen matrices.
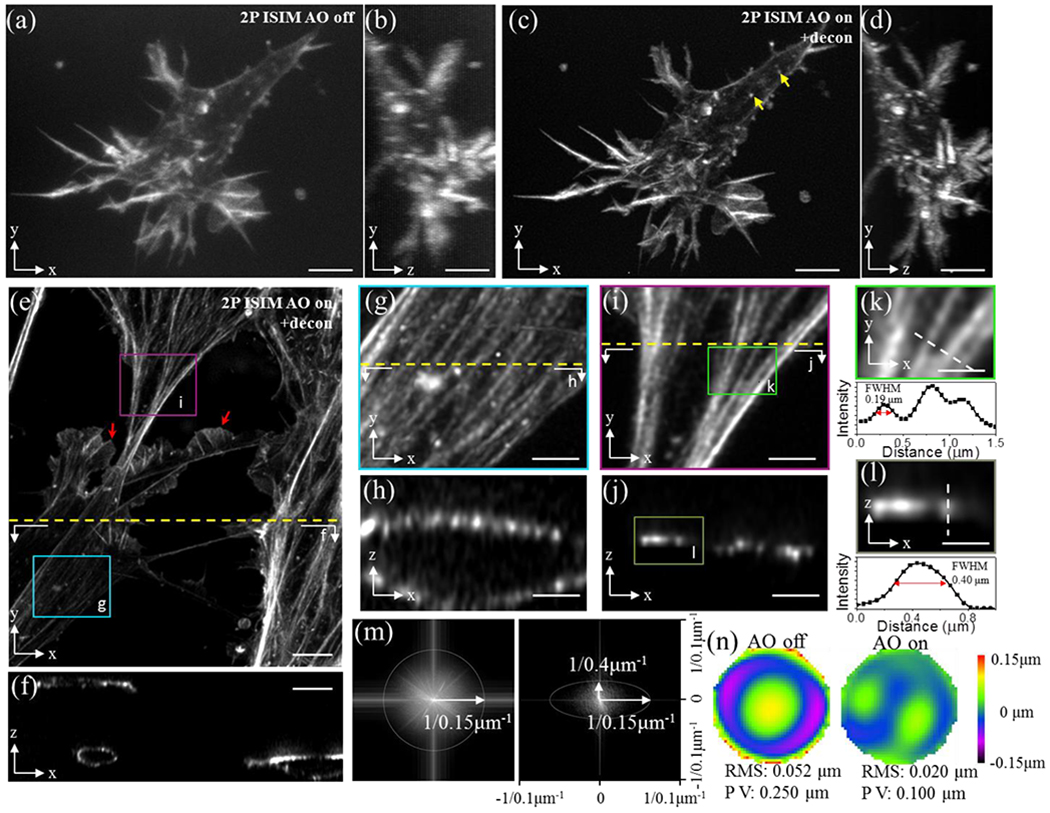
a) Rhodamine-phalloidin stained actin in a primary mouse endothelial cell, embedded in collagen matrix and imaged with 2P ISIM 150 μm from surface of coverslip. Lateral (a) and axial (b) views are shown. c, d) Images as in a, b but after AO correction using a 1 μm fluorescent bead fiducial as a guide-star. Additional cells 100 μm from the coverslip are also shown (lateral view, e) and axial view f). Higher magnification views of boxed regions in e) are shown in g, i along with corresponding axial views h, j. Resolution is estimated from actin bundles, laterally in k and axially in l (higher magnification views of boxed region in i, j respectively), and further quantified in MTFs in m (lateral, left; axial, right). Wavefronts before (left) and after AO correction (right), corresponding to sample in e) are also shown (n). Note that (a-e, g, i) display maximum intensity projections; (f, h, j, l) are single plane cross sections as indicated by dotted lines in (e, g, i) and boxed region in j; and k is a single lateral plane at boxed region indicated in i). Yellow arrows in c) indicate cortical actin structures; red arrows in e) indicate lamellipodial structures. See also Supplementary Video 3. Scale bars: 5 μm (a-f), 2 μm (g-j), 1 μm (k, l).