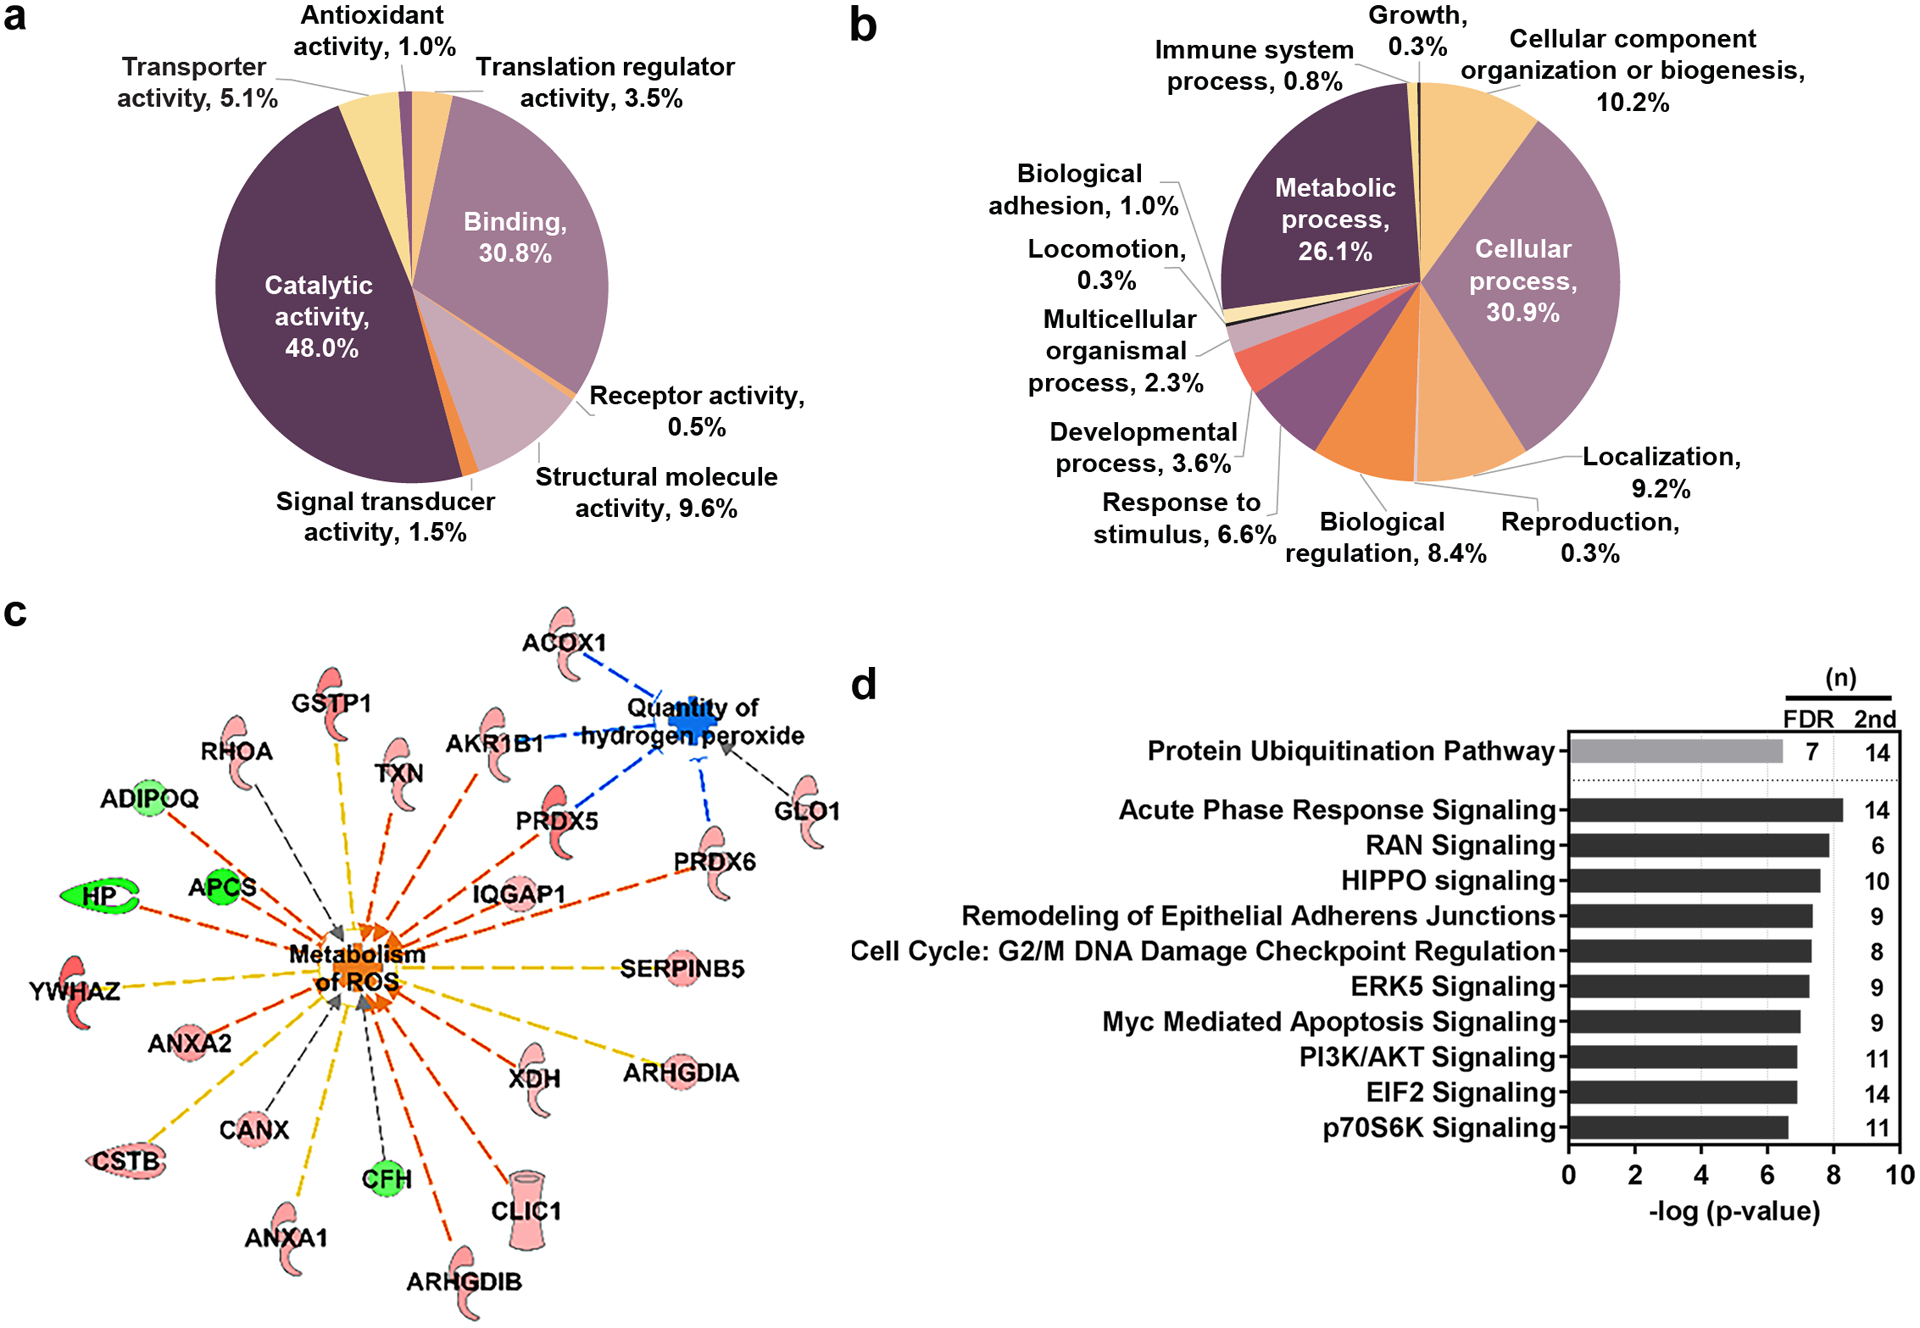
Figure 2. Functional analysis of the significant differentially expressed proteins.

Proteins of interest were classified by PANTHER reporting (a) molecular function (b) and biological processes. (c) Functional analysis of the proteins with the secondary cut-off parameters utilizing IPA shows interactions of proteins suppressing oxidative stress through increased metabolism of ROS and reduced quantity of hydrogen peroxide. Upregulated proteins appear red in color and downregulated proteins are green. Indirect interactions are denoted by dashed lines. Blue lines suggest inhibition; orange suggest activation; yellow indicates inconsistent findings; grey indicates that an effect is not predicted. (d) Pathway analysis was conducted using IPA. Primary FDR analysis (gray bar) and secondary cut-off analysis (black bars). Bars represent the –log-transformed p-value calculated using a right-tailed Fisher Exact test of the number of focus genes in the dataset and the total number of genes known to be associated with the process. (n) indicates the number of proteins within our dataset that are involved in the corresponding pathway. IPA, Ingenuity Pathway Analysis. FDR, false discovery rate. ROS, reactive oxygen species.
