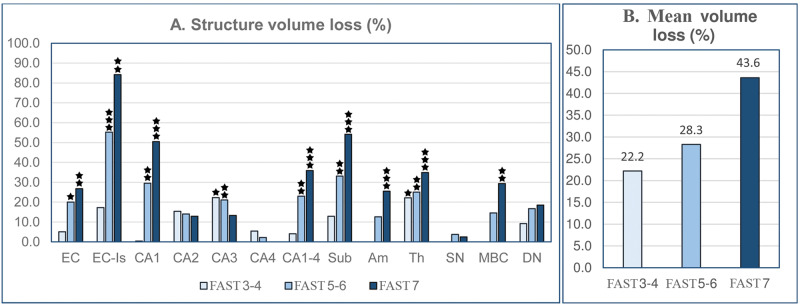
FIGURE 2.
Staging of volume loss in 13 structures in the brain of Alzheimer disease subjects (graph A). Volume loss (%) estimated in Functional Assessment Staging Test (FAST) stage 7 in comparison to 69- to 102-year-old controls shows regional differences in magnitude of atrophy, ranging from a low percentage in CA4 and substantia nigra to approximately 50.5% in the CA1 and 54.2% in the subiculum, and more than 84.2% in the entorhinal cortex islands (Table 4). The estimated average volume loss in structures with significant volume loss (graph B) shows a rather uniform progress of atrophy, with volume reduction by 22.2% in FAST stages 3–4, 28.3% in FAST stages 5–6, and 43.6% in FAST stage 7.

