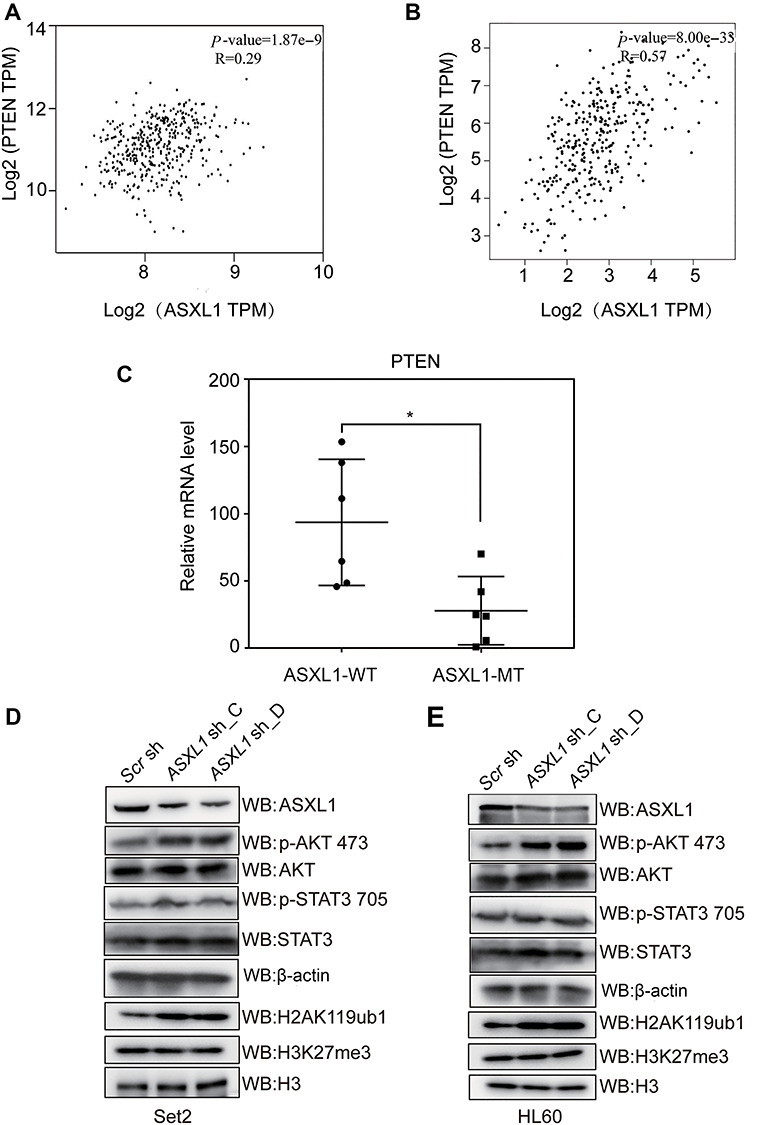
Figure 5.

Conserved ASXL1–PTEN/AKT axis in human leukemia. (A and B) Correlation analysis of ASXL1 and PTEN expression levels in bone marrow mononuclear cells of AML patients from GEO dataset (GSE37642) (A) and human whole blood cells from GTEx expression dataset (B). Significance level was determined using Pearson’s correlation test. (C) RT-qPCR analysis of PTEN expression levels in primary bone marrow mononuclear cells from MDS patients with (ASXL1-MT) or without (ASXL1-WT) ASXL1 mutations. The bar in the middle of each group represents the median. Significance level was determined using the two-tailed Student’s t-tests. *P ≤ 0.05. (D and E) WB analysis of ASXL1, p-AKT 473, AKT, p-STAT3 705, STAT3, H2AK119ub1, and H3K27me3 levels in Set2 cells (D) and HL60 cells (E) transduced with two different shRNA constructs targeting ASXL1 (ASXL1 sh_C and ASXL1 sh_D) or scramble shRNA (Scr sh). β-actin and H3 served as loading controls.
