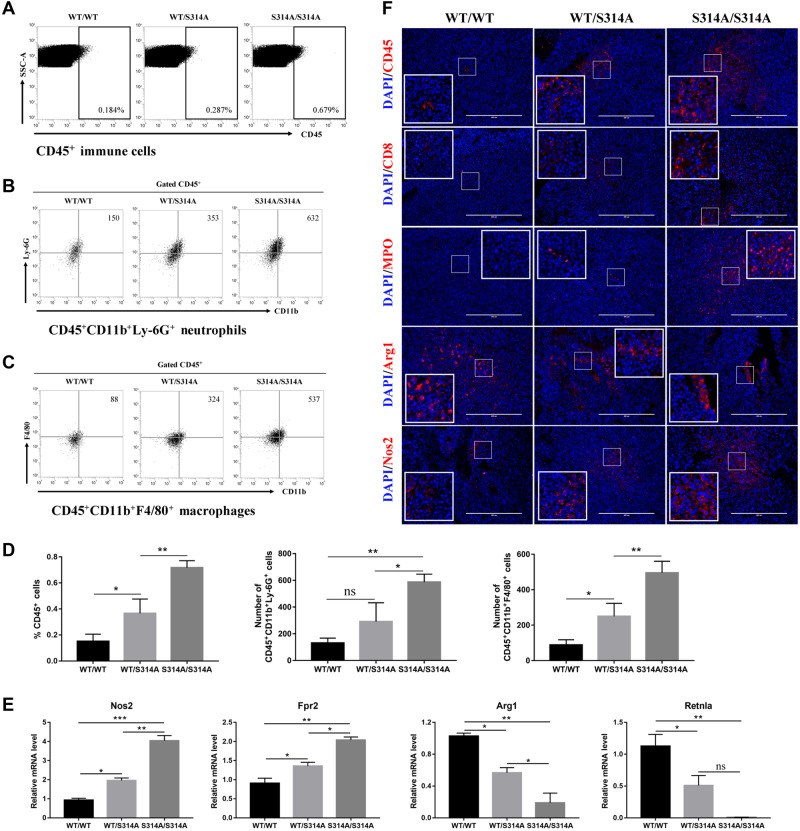
Figure 3.
MdmxS314A mice display improved immune cell infiltration and macrophage M1 polarization. (A‒C) Representative dot plots of immune cells (A), neutrophils (B), and macrophages (C) by flow cytometry in tumor tissues from wild-type, MdmxWT/S314A, and MdmxS314A/S314A mice. Immune cells are defined as CD45+ cells, neutrophils as CD45+CD11b+Ly-6G+ cells, and macrophages as CD45+CD11b+F4/80+ cells. (D) Quantitation of immune cells (left), neutrophils (center), and macrophages (right) by flow cytometry in tumor tissues from different genotypic mice. (E) Gene expression levels of Nos2, Fpr2, Arg1, and Retnla were determined by qPCR in tumor tissues from different genotypic mice (n= 3/group). Nos2 and Fpr2 are M1 genes while Arg1 and Retnla are M2 genes. (F) Immunofluorescence staining of tumor sections from different genotypic mice with indicated antibodies. Data shown are mean ± SEM; *P < 0.05, **P < 0.01, and ***P < 0.001 by one-way ANOVA followed by Tukey’s post hoc test. ns, non-significance. Scale bar, 400 μm.

