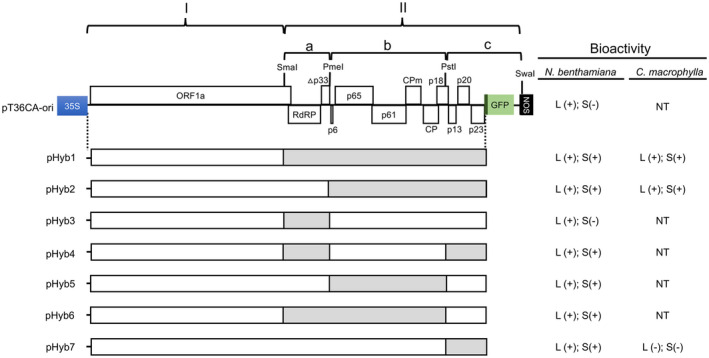
FIGURE 2.

A summary of the chimeric pT36CA‐pT36FL constructs pHyb1 to pHyb7, and the infectivity of the resulting chimeric viruses. Chimeric constructs with sequences corresponding to specific genomic regions of T36CA and T36FL were constructed and inoculated to transgenic (HC‐Pro) Nicotiana benthamiana plants by agroinfiltration. Virus preparations purified from specific chimeric construct‐inoculated N. benthamiana plants were inoculated to Citrus macrophylla plants by bark flap inoculation. Left panel: The schematic map of pT36CA‐ori (the same as in Figure 1a) showing the two regions (I and II), subregions (IIa, b, and c), and restriction enzyme sites (SmaI, PmeI, PstI, and SwaI) used to make the chimeric constructs. pHyb1 contains region I and II originated from pT36CA‐ori (white box) and pT36FL (grey box), respectively. Other constructs (pHyb2 to pHyb7) were generated by swapping the corresponding subregions (IIa, IIb and IIc) of pHyb1 and pT36CA‐ori. Right panel: Bioactivity of the chimeric viruses was determined by one or more of the following analyses/assays: visualization of green fluorescent protein (GFP) expression in treated plants, double antibody sandwich (DAS)‐ELISA of sap extracts, and transmission electron microscopy analysis of virus preparations. L and S represent local or systemic tissues, respectively; + and − represent the presence of absence of bioactivity. Note that for Hyb4 to Hyb7, although bioactivity in the systemic leaves of N. benthamiana plant is indicated by +, only sporadic GFP‐expressing foci were observed (accompanied by lower DAS‐ELISA absorbance readings (see Figure 4) relative to the abundant GFP signals (and high DAS‐ELISA absorbance values) observed for those of Hyb1 and Hyb2. NT denotes not tested
