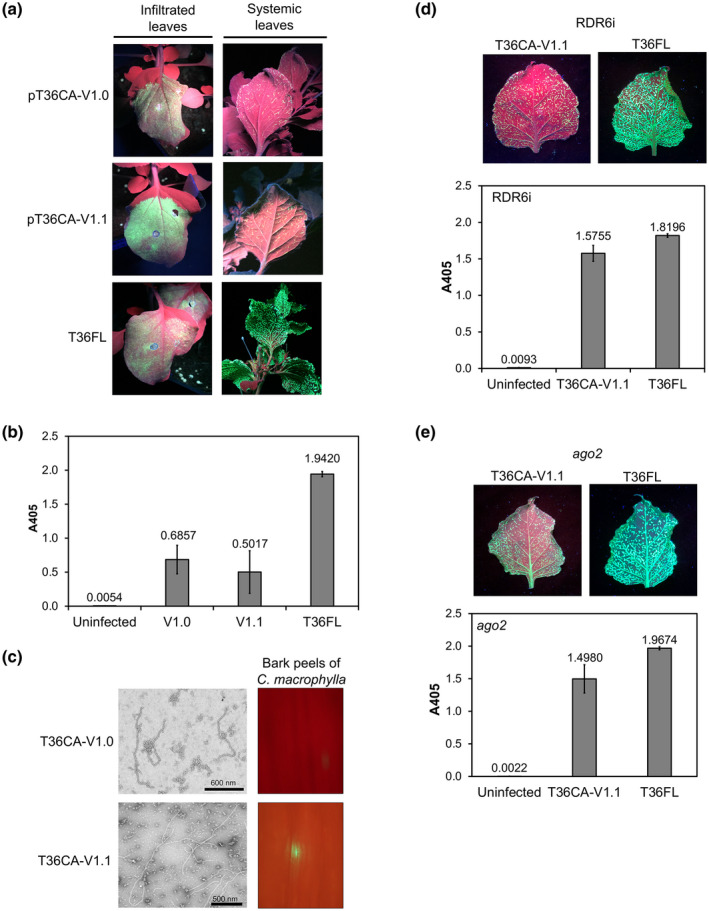
FIGURE 5.

The infectivity of T36CA with a single amino acid substitution introduced into each of two silencing suppressors. A conserved nucleotide from the T36CA population was engineered into the p20 gene, or in both the coat protein (CP [p25]) and p20 genes, of the prototype vector pT36CA‐V0 to replace a nonconserved/nonsynonymous variant identified in each of these genes. The resulting constructs, pT36CA‐V1.0 and pT36CA‐V1.1, and pT36FL (positive control) were each inoculated to transgenic (HC‐Pro‐expressing) Nicotiana benthamiana plants by agroinfiltration. pT36CA‐V1.0 encodes a p20 containing a serine to glycine substitution at position 107 (S107G), while pT36CA‐V1.1 encodes a CP containing a glycine to aspartic acid substitution at position 36 (G36D) in addition to a p20 with the S107G substitution. (a) Representative images showing the presence of green fluorescent protein (GFP) fluorescence in the infiltrated leaves and systemic leaves (attached on the plants) at 8 days postinfiltration and 8 weeks postinfiltration (wpi), respectively. (b) Virus accumulation in the systemic leaves was determined by double antibody sandwich (DAS)‐ELISA at 8 wpi. The A405 value for each virus/treatment indicated on the x axis is the average for three individual plant samples from a representative experiment (with error bar representing SE). (c) Left panels: transmission electron micrographs with scale bars (as indicated), showing the presence of virion‐like particles of T36CA‐V1.0 and T36CA‐V1.1. Right panels: Citrus macrophylla bark peels inoculated with the virion preparations of T36CA‐V1.0 and T36CA‐V1.1 observed under wide‐field fluorescence microscopy. (d) and (e) The systemic infectivity of T36CA‐V1.1 was examined in N. benthamiana RDR6i (coinfiltrated with an HC‐Pro‐expressing vector) (d) and ago2 (e) lines. Top panels: the distribution of GFP signals in the detached systemic leaves of pT36CA‐V1.1‐ versus pT36FL‐infiltrated plants at 9 wpi. Bottom panels: DAS‐ELISA results (for the viruses/treatment indicated on the x axes) following the agroinfiltration of N. benthamiana RDR6i (d) and ago2 (e) lines, with each A405 value being the average for four individual samples from a representative experiment (and error bar representing SE)
