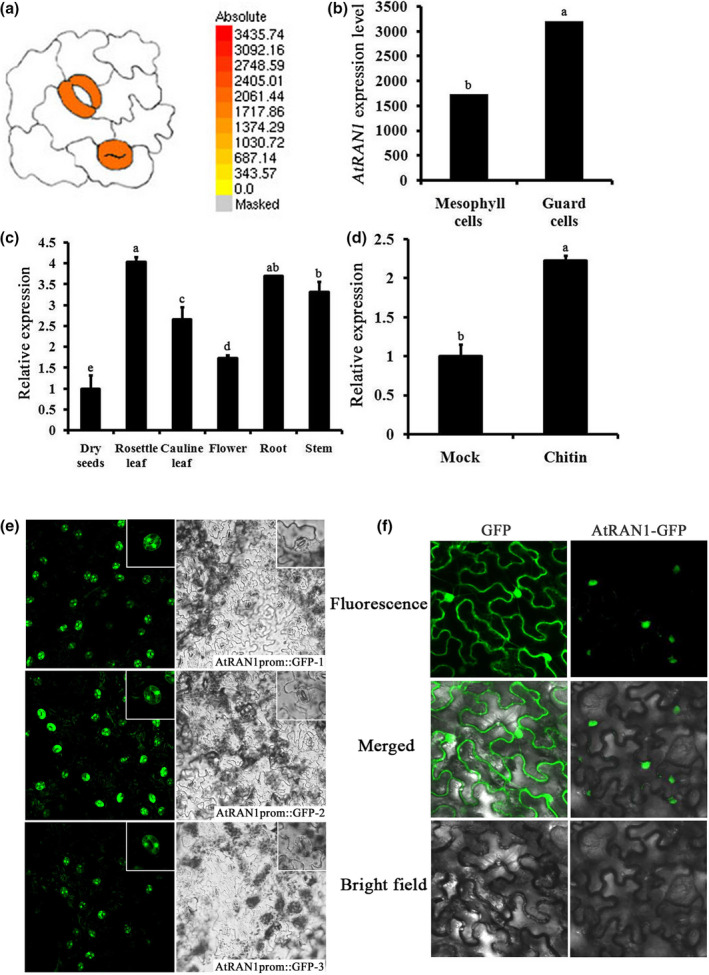
FIGURE 2.

AtRAN1expression in plants and AtRAN1 subcellular localization. (a) The expression ofAtRAN1in guard cells was monitored by microarray data from ATH1 Affymetrix (MIAMExpress, accession number: E‐MEXP‐1443; Yang et al.,2008) andArabidopsiseFP browser (http://www.bar.utoronto.ca/efp/cgi‐bin/efpWeb.cgi; Winter et al.,2007). (b) Gene Chip Operating Software‐normalized expression levels ofAtRAN1in leaf cells and guard cells were retrieved usingArabidopsiseFP Browser. (c) Quantitative reverse transcription PCR (RT‐qPCR) analysis of theAtRAN1expression in dry seeds, rosette leaf, cauline leaf, flower, root, and stem. (d) RT‐qPCR analysis ofAtRAN1expression upon chitin treatment. In all cases,AtRAN1transcript levels were normalized toS16andEF1αlevels. Error bars indicateSE. Each bar represents an average of three independent reactions, including both biological and technical replicates. (e) Visualization ofAtRAN1promoter::green fluorescent protein (GFP) expression in the epidermis of transgenicArabidopsislines (AtRAN1promoter::GFP‐1, 2, 3) by confocal microscopy.(f) Transient expression of AtRAN1‐GFP fusion protein inNicotiana benthamianaleaves. AtRAN1‐GFP expression was driven by cauliflower mosaic virus 35S promoter and transiently expressed inN. benthamianaleaves by agroinfiltration
