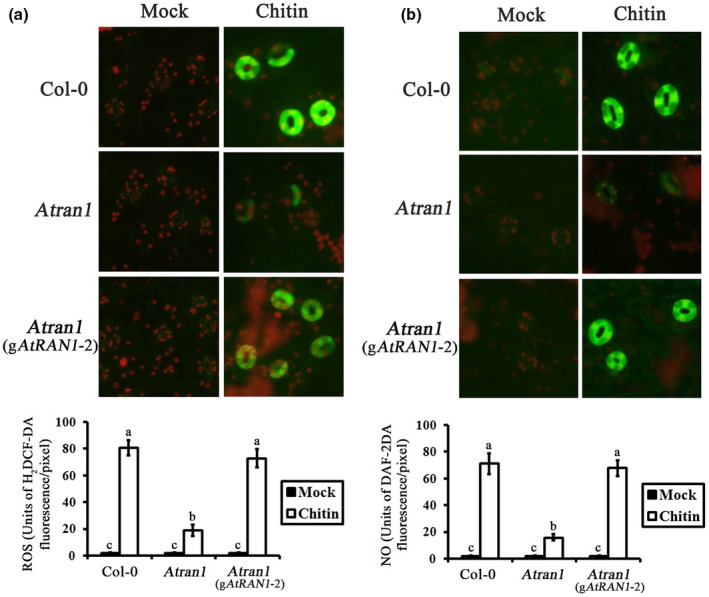
FIGURE 5.

Reactive oxygen species (ROS) and nitric oxide (NO) levels in stomata ofAtran1mutant plants after chitin treatment. (a) H2DCF‐DA was loaded into the epidermal peels cells, and fluorescence images and pixel intensities were recorded in the guard cells of Col‐0,Atran1mutant, and g AtRAN1plants after addition of 50 µg/ml chitin. (b) DAF‐2DA was loaded into epidermal peels cells, and fluorescence images and pixel intensities were recorded in guard cells of Col‐0,Atran1mutant, and gAtRAN1plants after addition of 50 µg/ml chitin. Each measurement is the average of three replicates; experiments were repeated twice with similar results. Data for fluorescence intensity of ROS and NO generation are presented as means ± SEof three independent experiments
