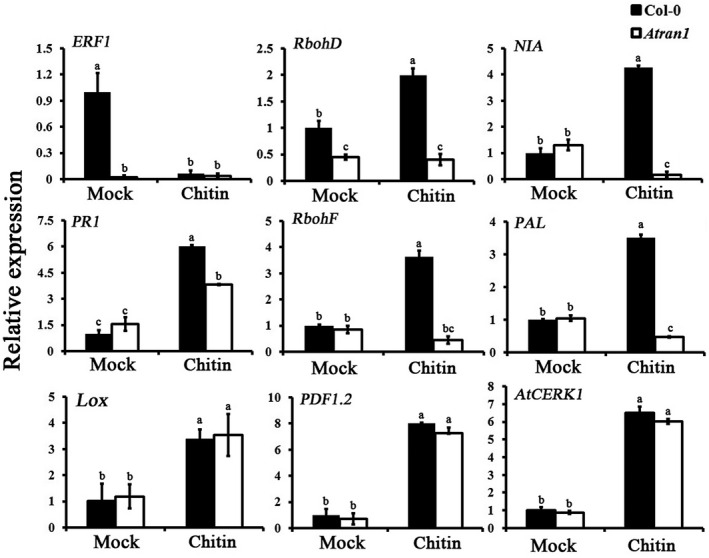
FIGURE 7.

Expression analyses of the indicated defence‐responsive genes inAtran1mutant plants in response to chitin. Samples (n = 5) with or without chitin treatment were collected. Values represent means ± SEfrom three independent experiments; different letters denote statistically significant differences among different treatments as determined by ANOVA (LSD test,p < .05)
