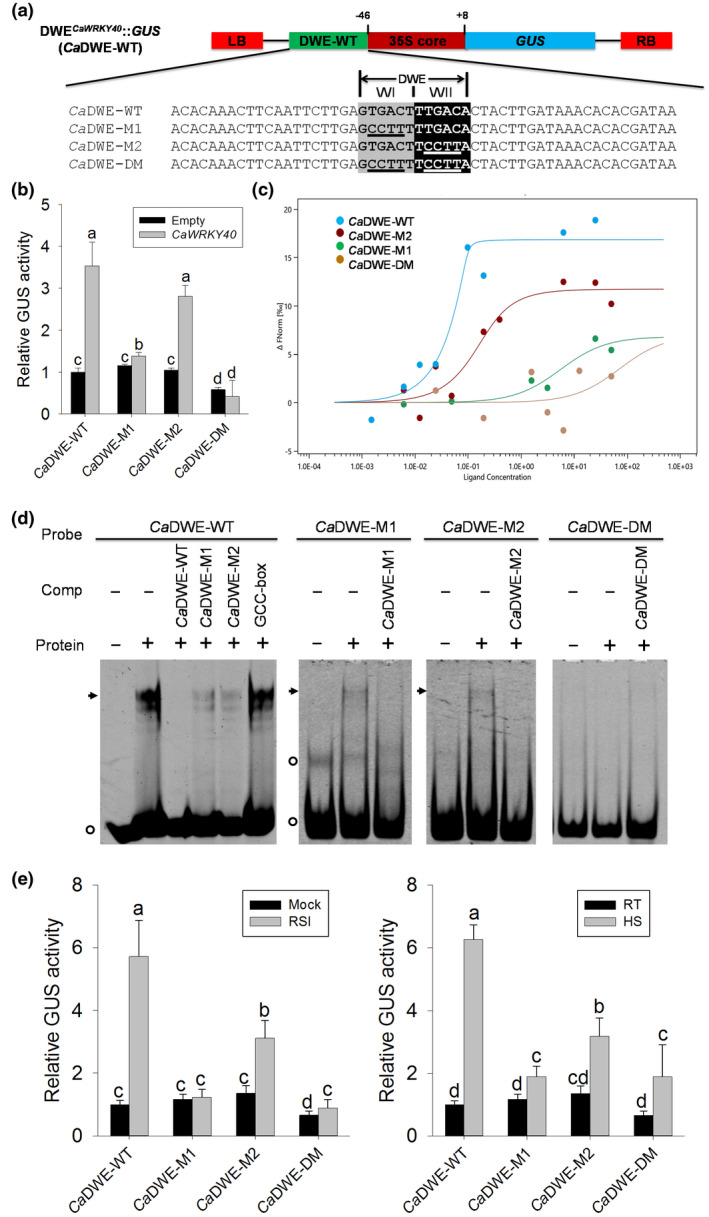
FIGURE 3.

Trans‐activation analysis of the CaDWE in CaWRKY40−1,802 to −1,464 in response to CaWRKY40 overexpression, Ralstonia solanacearum inoculation (RSI) and heat shock (HS). (a) Linear structure of the DWECaWRKY40::GUS vector (CaDWE‐WT), sequences of DWECaWRKY40 motif and its three mutated versions (CaDWE‐M1, CaDWE‐M2, and CaDWE‐DM). DWE, double W boxes element; LB, left border; RB, right border; M, mutant; DM, double mutant. Nucleotides highlighted with grey and black represent the W box motif. Nucleotides underlined indicate the mutated sequences of W box motif. (b) β‐Glucuronidase (GUS) activity analysis of CaDWE‐WT and its three mutated versions transiently expressed in pepper plants in response to CaWRKY40 overexpression. (c) A microscale thermophoresis (MST)‐based binding experiment was performed to confirm the binding of purified CaWRKY40 to CaDWE‐WT and its mutated versions. The bound states of the molecule display different thermophoretic depletion profiles. The difference in thermophoresis can be plotted as a change in normalized fluorescence versus ligand concentration to obtain a binding curve. (d) The electrophoretic mobility shift assays (EMSAs) were performed with purified CaWRKY40‐6×His protein and Cy5‐labelled probes. One hundred‐fold excess of unlabelled probes were used as competitors. The GCC‐box (2 × AGCCGCC) was used as a negative competitor. Black arrows indicate specific shifts. Circles indicate nonspecific shifts or a free probe. Experiments were repeated at least three times. Protein, purified CaWRKY40‐6×His protein. (e) GUS activity analysis of CaDWE‐WT and its three mutated versions in pepper plants in response to RSI and HS. (b) and (e) The CaDWE‐WT and its mutated versions were transformed by agroinfiltration in pepper leaves. At 24 hr postinfiltration, CaWRKY40 was coexpressed in the infiltrated pepper leaves (b), treated with RSI and HS (e), respectively, followed by harvesting for GUS measurement at 24 hr posttreatment. The GUS activities of pepper leaves transformed with CaDWE‐WT without treatment or CaWRKY40 overexpression were both set to 1. Data represent the mean ± SD of three independent biological experiments. Error bars represent ± SD (n = 3) from three independent experiments and different letters (a to d) indicate significant differences, as determined by Fisher's protected least significant difference test
