FIGURE 2.

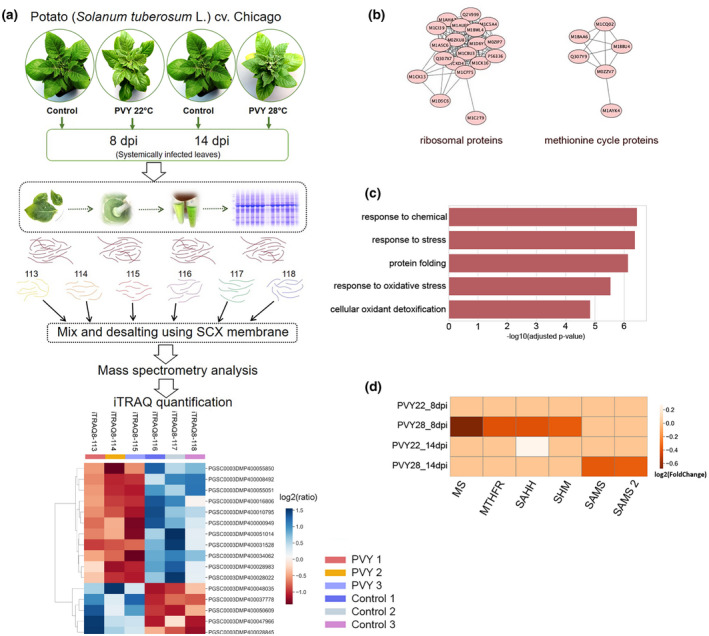
(a) The strategy for comparative quantitative analysis of protein expression in potato leaves by 8‐plexisobaric tags for relative and absolute quantitation (iTRAQ). For detailed iTRAQ data see Tables S2 and S3. (b) Protein–protein interaction networks of differentially expressed proteins (DEPs). Proteins are indicated with nodes, and interactions between proteins are represented by edges. M1CQ02‐MS; M1BBU4‐MTHFR; M0ZZV7–SAHH; Q307Y9‐SAMS 1; M1BAA6‐SHM; M1AYK4‐S‐formylglutathione hydrolase. (c) GO enrichment analysis of the up‐regulated DEPs in infected potato plants at 14 days postinoculation (dpi) at 28 °C. (d) Heatmap showing the changes in abundance of key enzymes of the methionine cycle (MTC) and MTC‐related folate cycle. PVY22_8dpi, infected potato plants at 8 dpi at 22 °C; PVY28_8dpi, infected potato plants at 8 dpi at 28 °C; PVY22_14dpi, infected potato plants at 14 dpi at 22 °C; PVY28_8dpi, infected potato plants at 14 dpi at 28 °C
