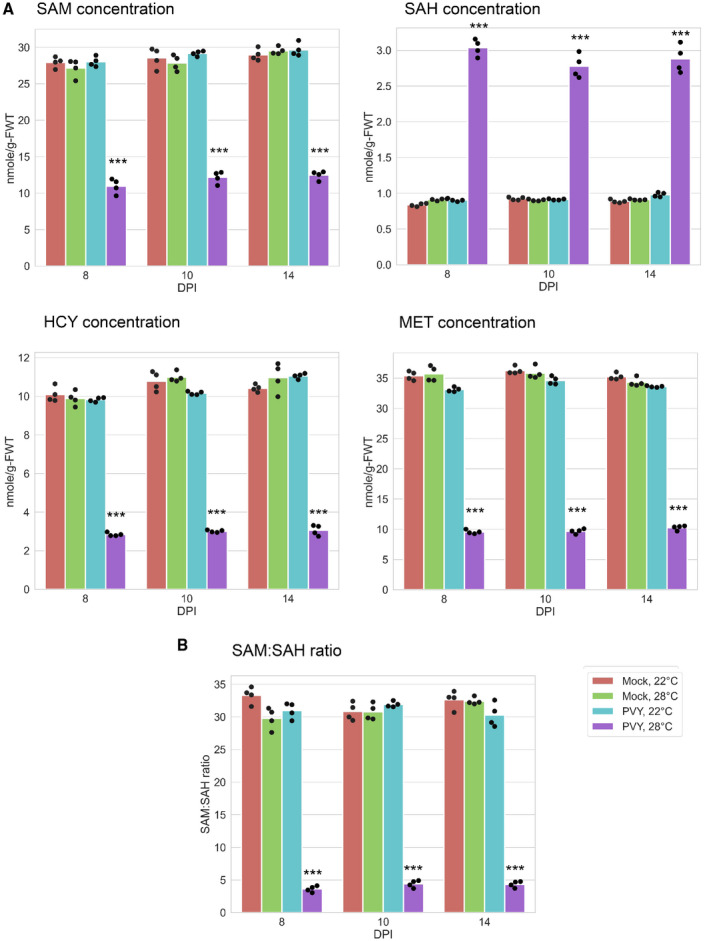
FIGURE 4.

Content of methionine cycle (MTC) metabolites in systemically infected leaves of potato plants at 22 or 28 °C at 8, 10, and 14 days postinoculation (dpi) as shown. (a) Content of S‐adenosylmethionine (SAM), S‐adenosylhomocysteine (SAH), and homocysteine (HCY) was measured by ELISA. Content of methionine (MET) was measured using methionine assay kit (fluorometric). (b) The ratios of SAM to SAH. Analysis of variance and Tukey's HSD post hoc tests were performed for data. ***p < .001
