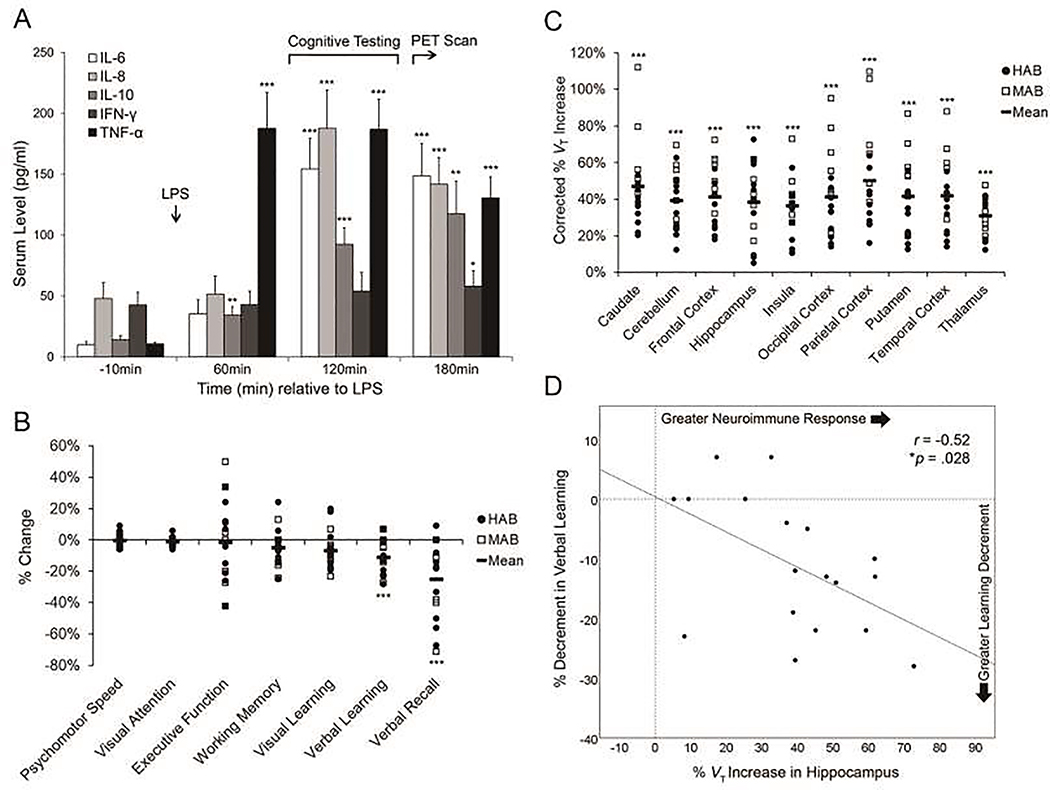
Figure 1. LPS-induced neuroimmune response and cognitive performance decrements.
A) Serum cytokine concentrations (pg/ml) are depicted. Error bars: ± 1 standard error of the mean. B) Individual subject values of the LPS-induced percentage change in cognitive task performance are depicted (HABs = filled circles; MABs = unfilled squares; black bars = task mean). C) Individual subject values for the LPS-induced percentage increase in [11C]PBR28 VT for each ROI, corrected for rs6971 genotype, are depicted (HABs = filled circles; MABs = unfilled squares; black bars = ROI mean). D) The LPS-induced percentage increase in hippocampal TSPO levels was correlated with the LPS-induced percentage decrement in verbal learning (r=−0.52, *p=.028). Note: *p<.05; **p<.01; ***p<.001.

