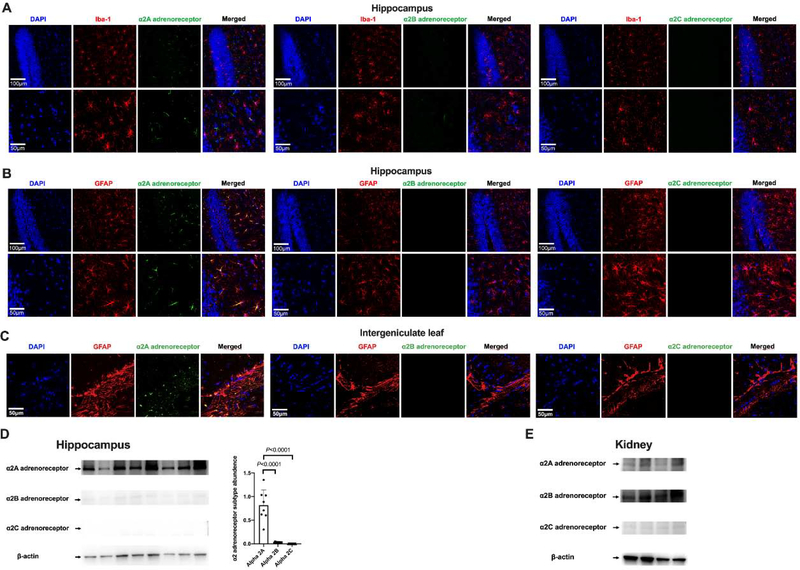
Fig. 11.
Immunofluorescent staining and Western blotting analysis of α2 adrenoceptor subtypes in the brain and kidneys. (A) Co-localization of α2 adrenoceptor subtypes with Iba-1 in the hippocampus. (B) Co-localization α2 adrenoceptor subtypes with GFAP in the hippocampus. Scale bar = 100 μm in the upper panel and = 50 μm in the lower panel for panels A and B. (C) Co-localization α2 adrenoceptor subtypes with GFAP in the intergeniculate leaf. Scale bar = 50 μm. (D) Left panel: representative Western blotting images of samples from the hippocampus. Right panel: quantitative results of HMGB1 and RAGE in the hippocampus. Results are expressed as mean ± S.D. (n = 8 in each group). Each animal data point in the bar graph is also presented. (E) Representative Western blotting images of samples from the kidneys.

