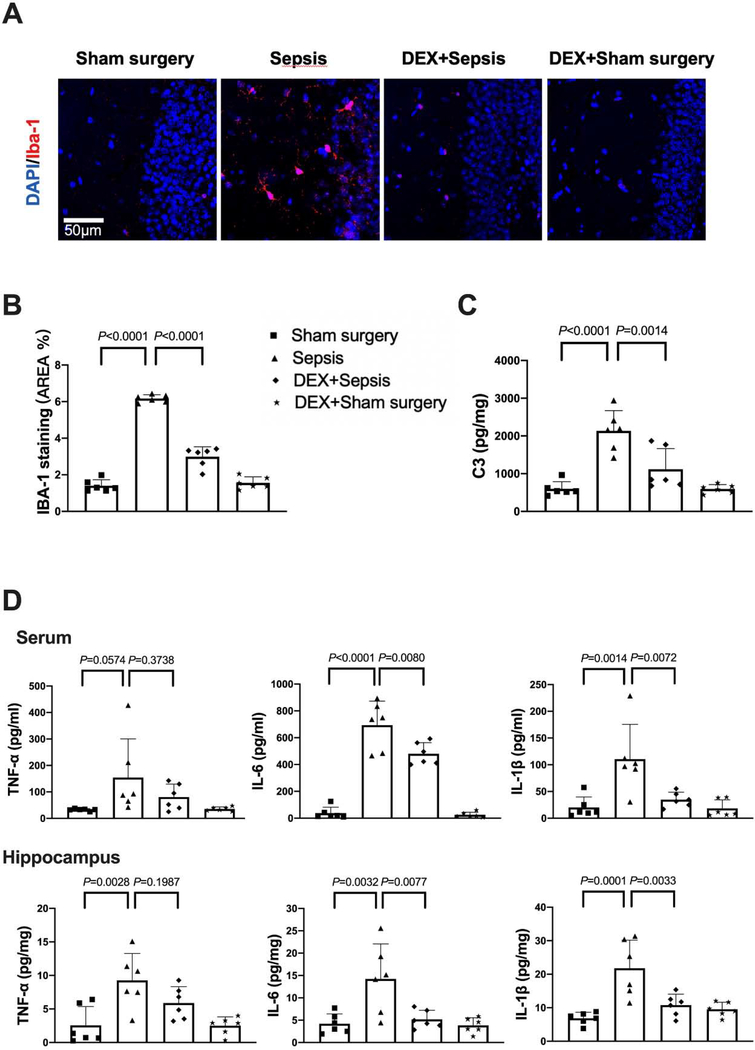
Fig. 5.
Dexmedetomidine attenuated sepsis-induced systemic inflammation and neuroinflammation. (A) Representative immunofluorescent images. Scale bar = 50 μm. (B) Quantitative results of the percentage of Iba-1 positive area in the total area of the image in the hippocampus. (C) C3 concentration in the hippocampus. (D) Concentrations of TNF-α, IL-6 and IL-1β in the serum and hippocampus. All results are expressed as mean ± S.D. (n = 6 in each group). Each animal data point in the bar graph is also presented. Dex: dexmedetomidine.

