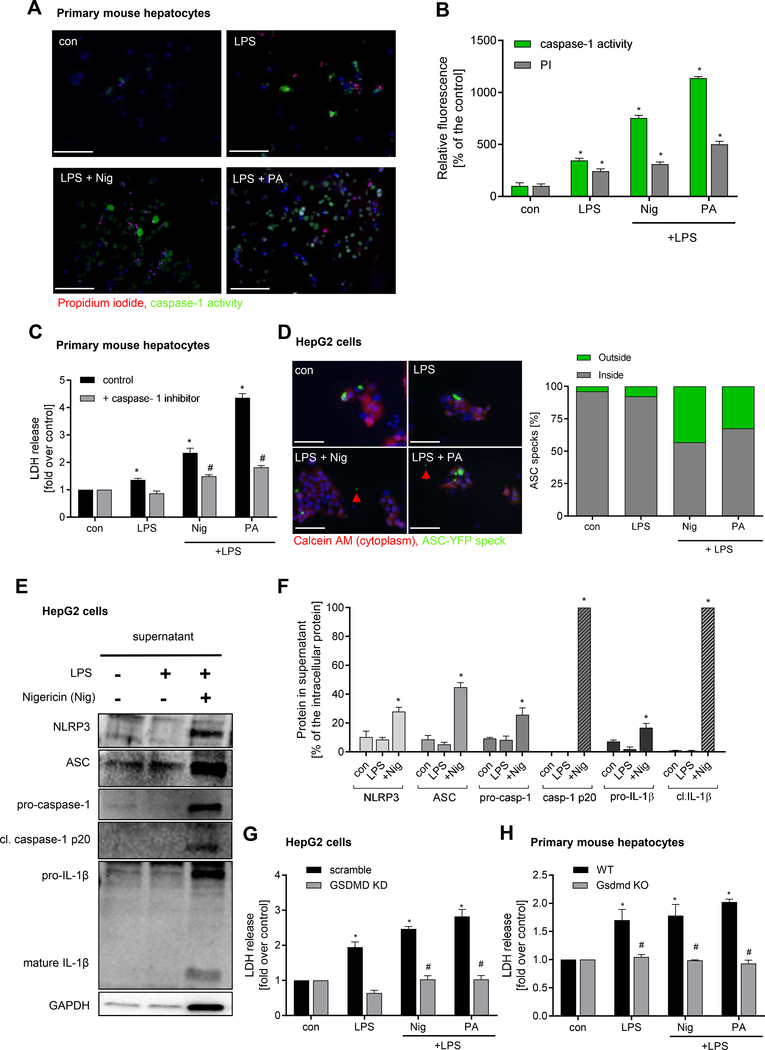
Figure 1. Hepatocytes undergo pyroptotic cell death following NLRP3 inflammasome activation.
Representative immunofluorescence images (A) and quantification (B) showing pyroptosis induction by LPS + Nig and LPS + PA in primary mouse hepatocytes (*p< 0.05 compared to control, #p< 0.05 compared to LPS) (scale bar: 100 μm). (C) LDH release in presence of caspase-1 inhibitor (*p< 0.05 compared to control, #p< 0.05 compared to LPS + Nig and LPS + PA, respectively). (D) Representative images showing release of ASC specks from HepG2 cells transfected with a plasmid expressing ASC-YFP and treated with LPS + Nig and LPS + PA (scale bar: 10 0μm). Intra- an dextracellula rspeck swer equantified and compared to control. Western blot (E) and densitometric analysis (F) of cell-free supernatant of HepG2 cells after treatment with LPS and LPS + Nig for NLRP3 inflammasome components (NLRP3, ASC, pro-caspase1, pro-ILf) an dit scleave dmatur eform s(cleaved caspase-1 p20, mature IL-1ß 17kDa). Level of extracellular proteins were calculated as % of their intracellular protein amount (F) (*p< 0.05 vs. control). (G) LDH release of Gasdermin D (KD) silenced or scramble siRNA transfected HepG2 cells treated with LPS + Nig or PA. (H) LDH release frol primar ymurin ehepatocyte so fGsdmdK Ocompare dt oW Tmice treated with LPS + Nig or PA. Data was normalized to control serum-free media (*p< 0.05 vs. control, #p<0.05 vs. WT hepatocytes). Gaussian distributed data were analyzed using One-way analysis of variance and Bonferroni post-hoc test.

