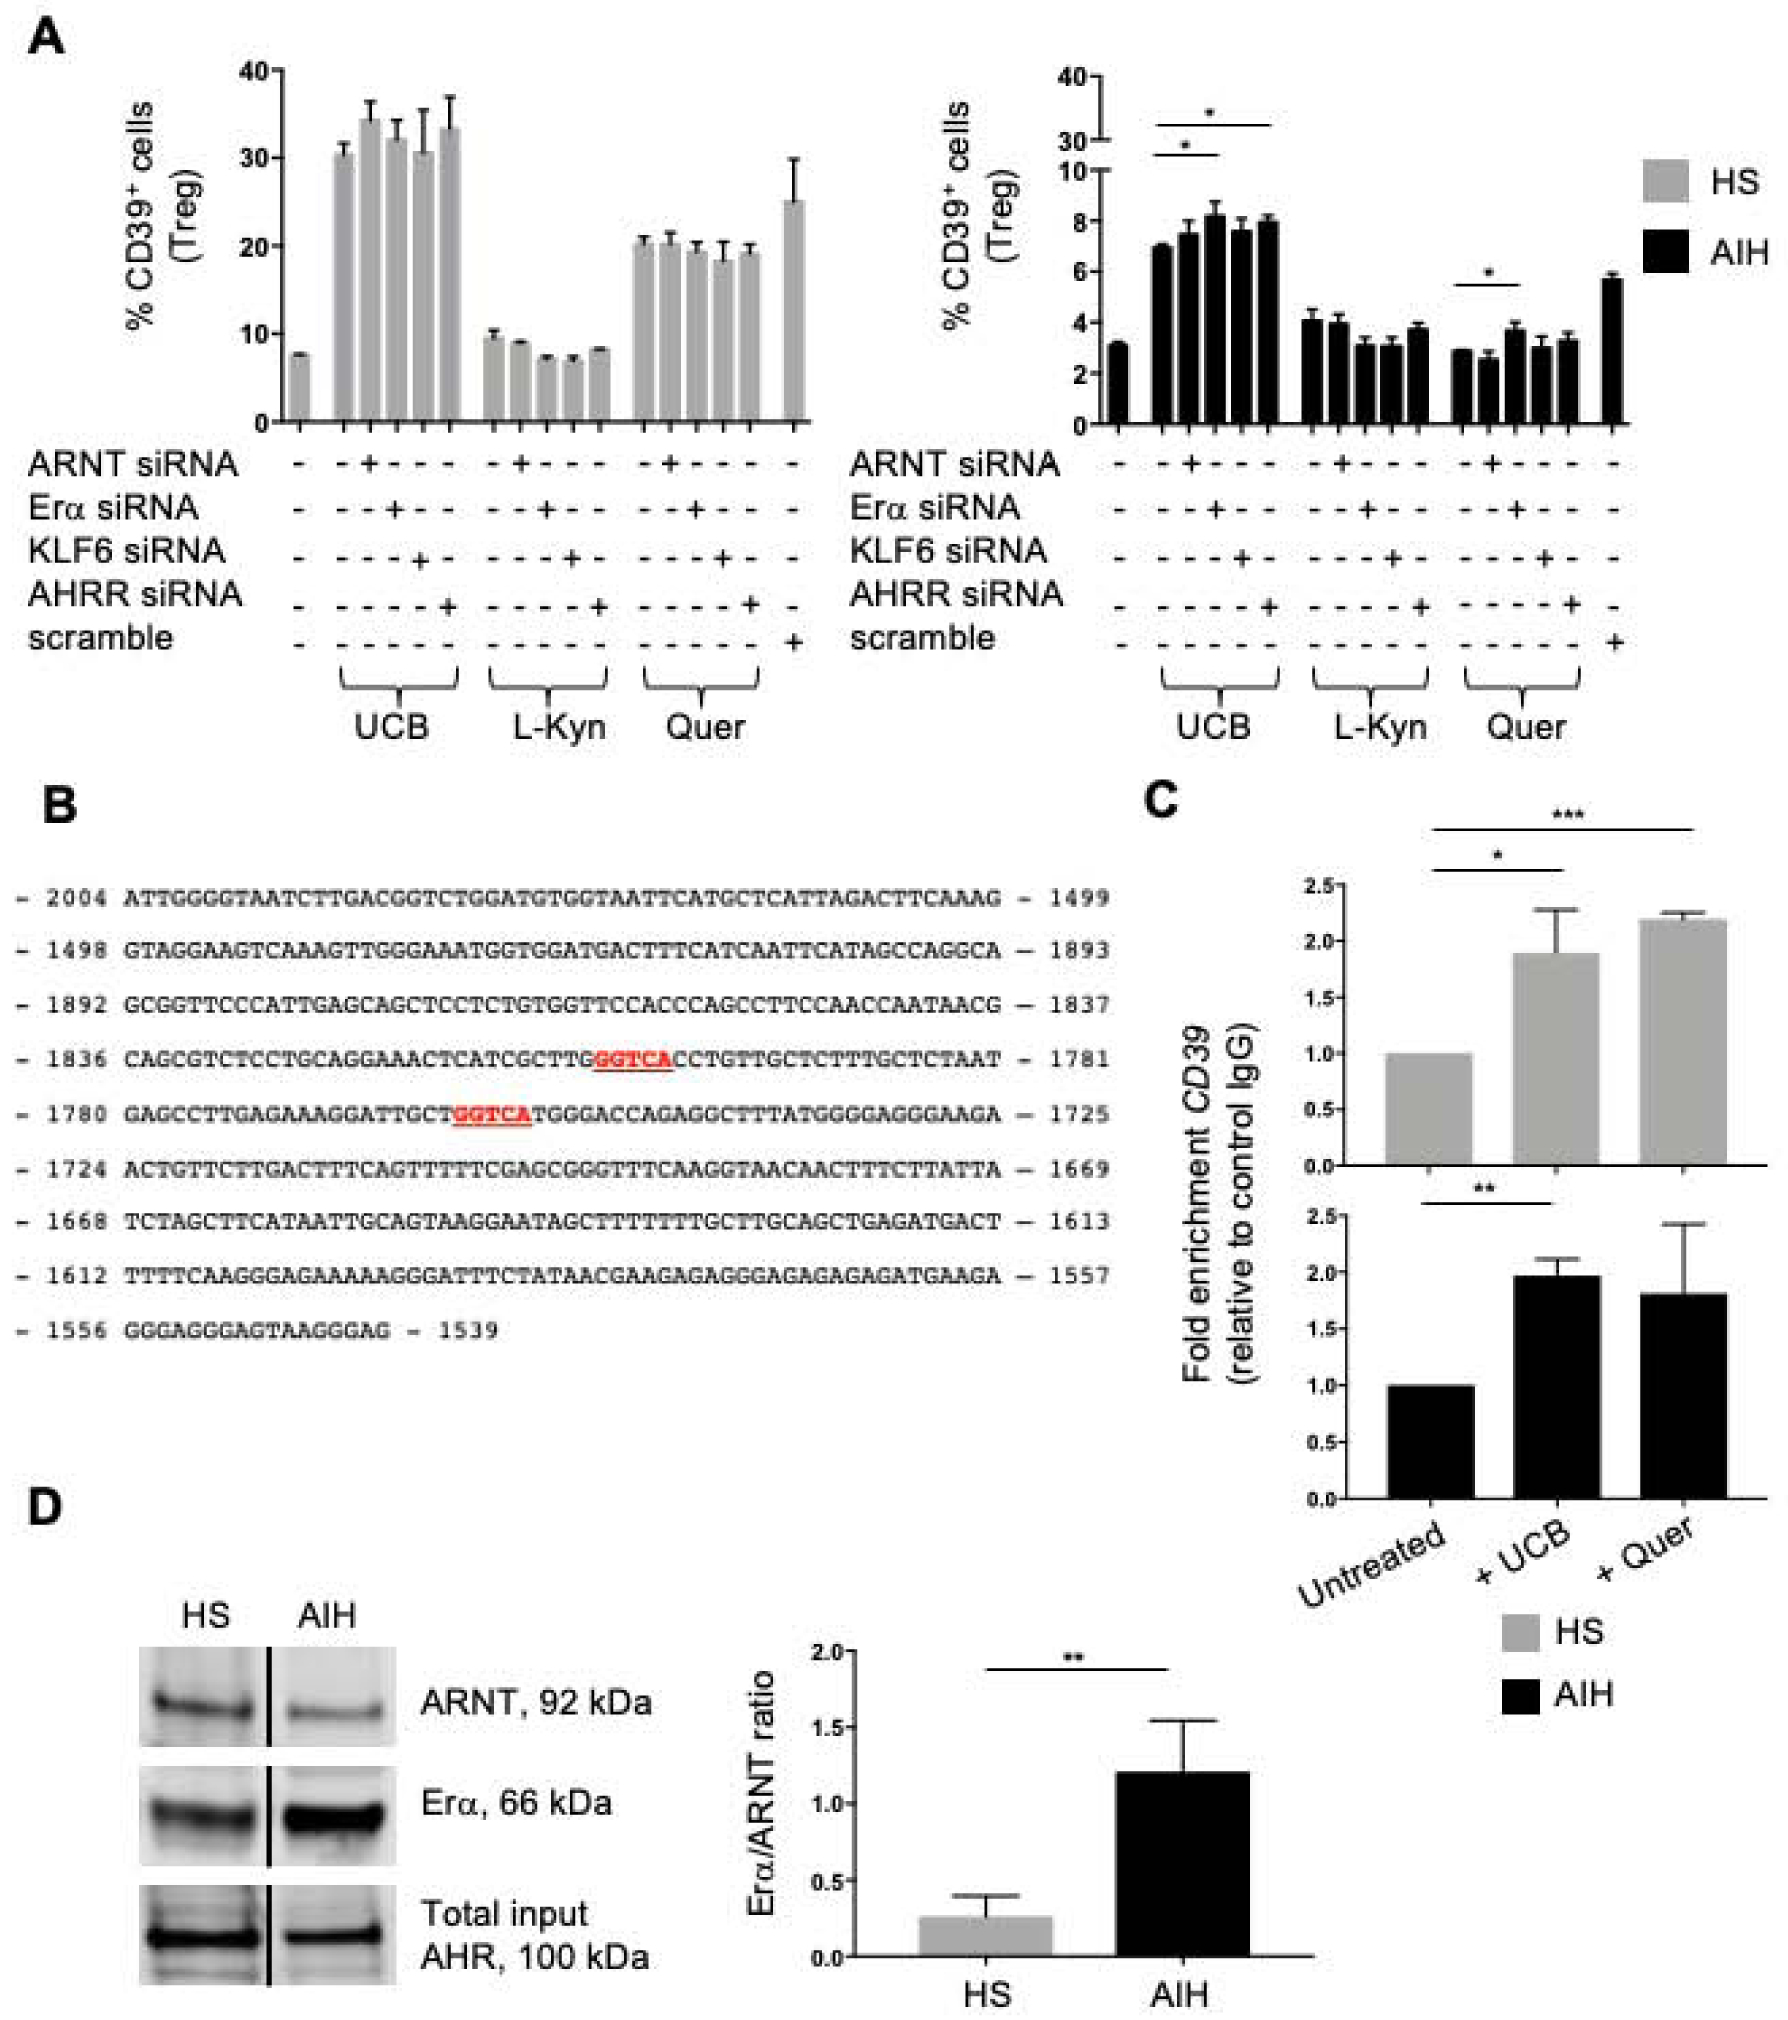
Figure 4. Silencing of Erα and AHRR increases Treg response to UCB and quercetin in AIH.

(A) Mean+SEM CD39+-cell frequency within untreated, siRNA (or scramble)-treated Treg before and after AHR ligand exposure (HS, n=10; AIH, n=14). (B) Putative Erα binding sites (in red) within CD39 promoter. (C) Mean+SEM fold enrichment in CD39 (CHiP) in untreated and ligand-treated Treg (HS, n=3; AIH, n=3). (D) Immunoblot (cropped) of ARNT and Erα in AHR-immunoprecipitated Treg exposed to UCB. AHR expression in input samples is represented. Mean+SEM ARNT/Erα ratio is shown (HS, n=4; AIH, n=4). *P≤0.05; **P≤0.01; ***P≤0.001 (one-way ANOVA and unpaired t test).
