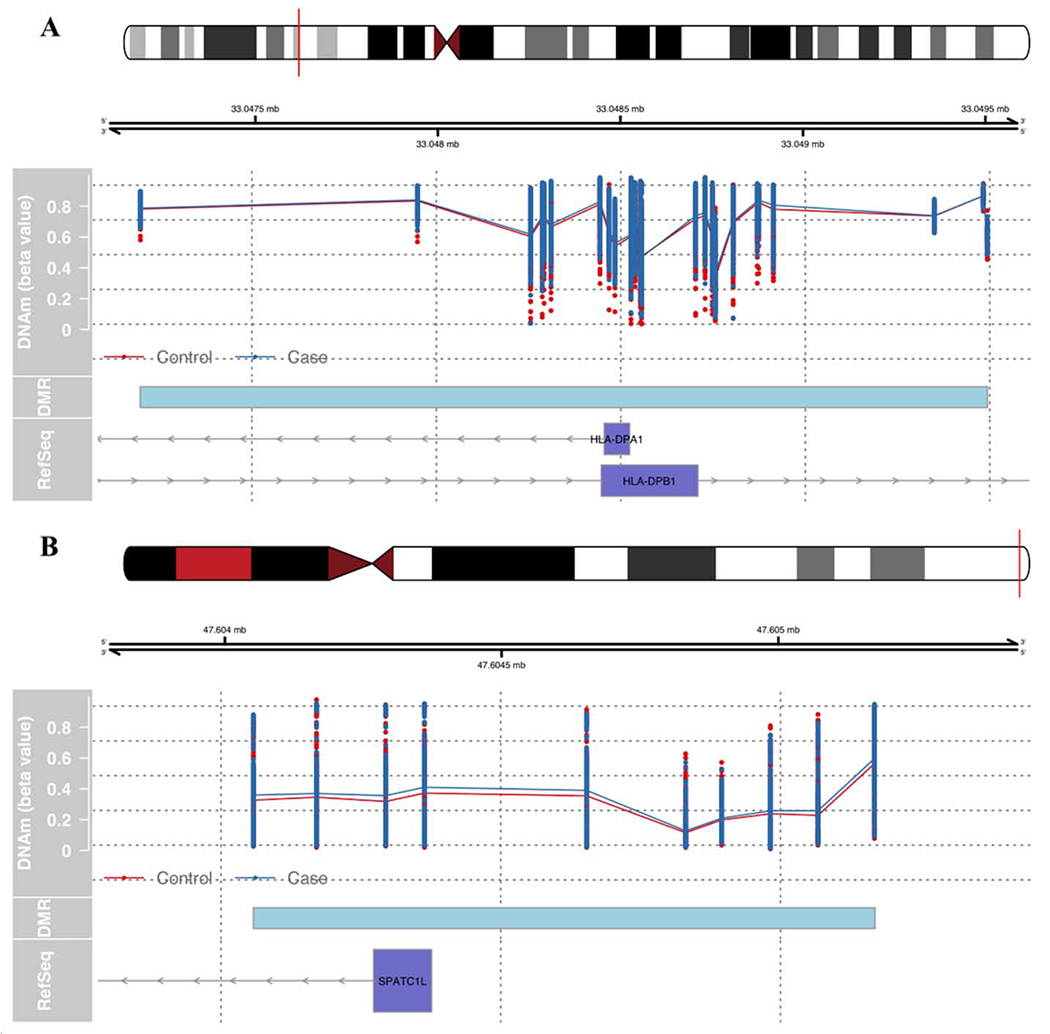
Fig 1: PTSD-associated DMR regions in the discovery cohort.

Unadjusted methylation values for the control (red) and PTSD case (blue) groups. Cyan box represents DMR region. The blue axis represents the known RefSeq genes downloaded from UCSC browser: (A) region near HLA-DPA1 and HLA-DPB1L, (B) region near SPATC1.
