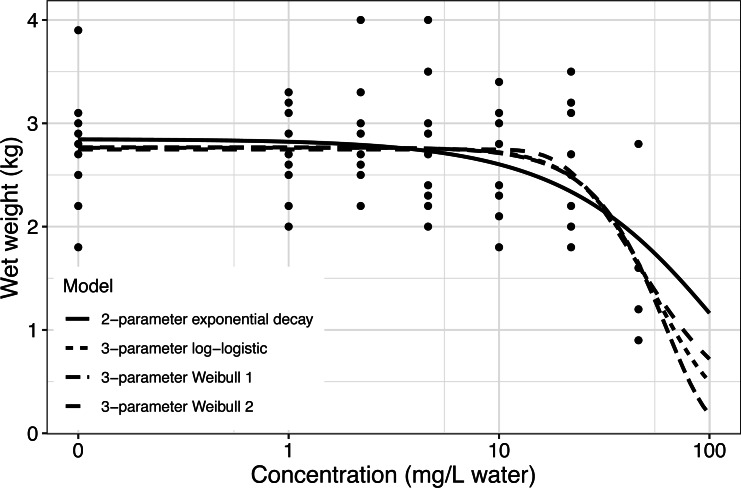
Figure 2. Fitted concentration–response curve for the two-parameter exponential decay model, the three-parameter log–logistic model and the two different Weibull models fitted to the Rainbow trout data, (Organisation for Economic Co-operation and Development(OECD), 2006).
The curve is shown together with all data points. The Rainbow trouts were exposed to different concentrations (mg/L water) of an unknown agent.

