
Figure 3 .
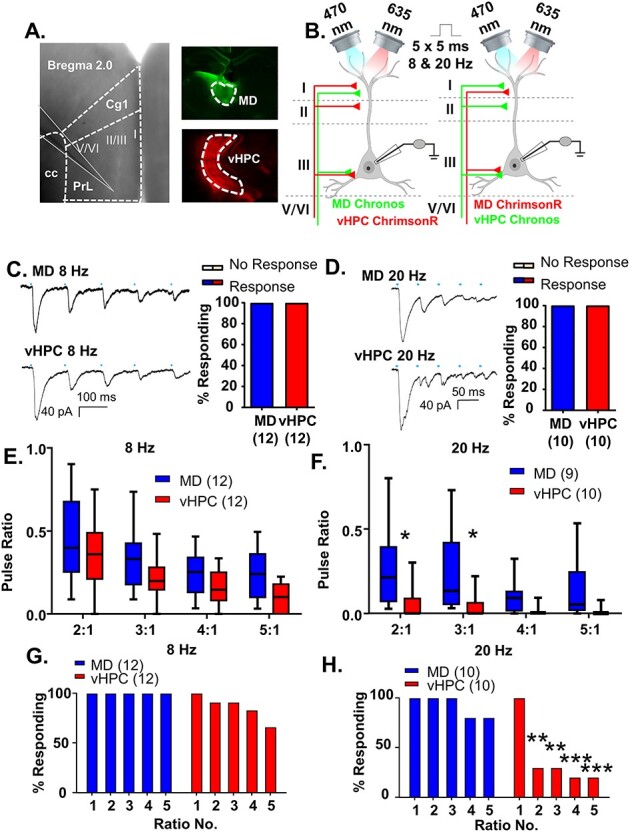
MD and vHPC inputs converge onto layer 2/3 mPFC pyramidal neurons but display different frequency-dependent synaptic dynamics. (A) Low power representative image indicating recording location in layer 2/3 of prelimbic mPFC (left; Prl is prelimbic cortex, Cg1 is cingulate cortex and cc is corpus callosum). Low power images illustrating injection spread of Chronos within the mediodorsal thalamus (MD, top right, green) and ChrimsonR within the ventral hippocampus (vHPC, bottom right, red). (B) Cartoon schematic illustrating the experiment. Animals expressing either Chronos or ChrimsonR in the MD and the opposite opsin in the vHPC were stimulated with five, 5-ms pulses of 470 or 635 nm light, respectively, at a frequency of 8 or 20 Hz while recording from mPFC pyramidal neurons. (C) Example traces of currents evoked in layer 2/3 mPFC pyramidal cells in response to five, 5-ms pulses of 470 or 635 nm light stimulating MD and vHPC terminals at 8 Hz. (D) Example traces of currents evoked in layer 2/3 mPFC pyramidal cells in response to five, 5-ms pulses of 470 or 635 nm light stimulating MD and vHPC terminals at 20 Hz. (E) The ratio of responses to repeated light stimuli relative to the first stimulus was similar for stimulation of MD or vHPC terminals at 8 Hz. There was no significant difference between the ratio of any of the responses for stimulation of the MD versus vHPC in the Bonferroni-corrected posthoc analysis. (F) The ratio of responses to repeated light stimuli relative to the first stimulus differed for stimulation of MD versus vHPC terminals at 20 Hz. There was a significant difference between the ratio of the second and third stimulation relative to the first for the MD versus vHPC in the Bonferroni-corrected posthoc analysis. (G) The percent of cells showing a significant (>2× standard deviation of the baseline noise) response to each pulse of light for vHPC versus MD was slightly attenuated for pulses 2–5 for stimulation of the vHPC relative to the MD at 8 Hz. (H) The percent of cells showing a significant response to each pulse of light for vHPC versus MD at 20 Hz. A large number of cells failed to show a significant response to repeated stimulations of vHPC terminals; this was not the case for stimulation of the MD. Differences in the percent of cells responding to stimulation of the 2 inputs based on Chi-square analysis are indicated by significance stars. *P < 0.05; **P < 0.01; ***P < 0.001.