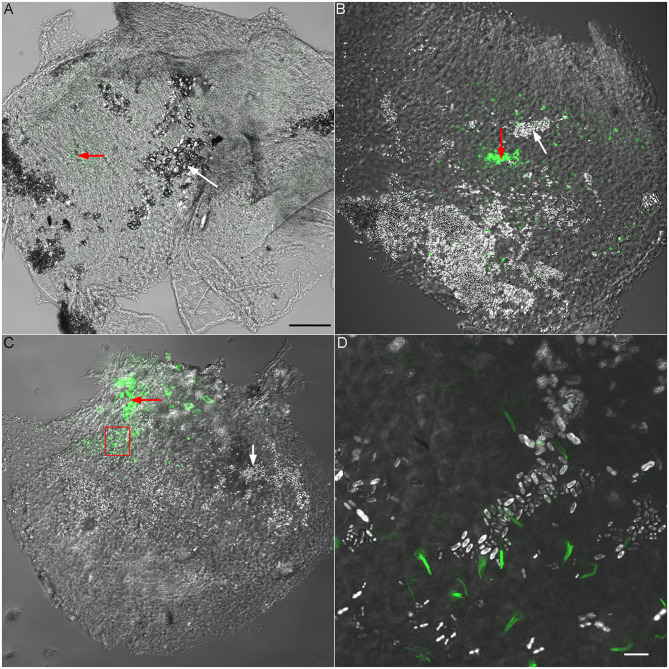
Figure 4.
Validation of recording site using fluorescent phalloidin. (A) Superimposed confocal and DIC images (10 × lens) obtained from a P6 utricle. Fluorescent phalloidin was injected to the recording site by applying a positive pressure to the recording electrode after ELP was recorded. The area with fluorescent signal is marked by a red arrow. A white arrow marks otoconia in a nearby area. Scale bar: 100 μm [for (A), (B) and (C) panels]. (B) Superimposed confocal and DIC images of a P6 saccule. A red arrow marks the area with fluorescent signal (recording site) while a white arrow marks otoconia. (C) Superimposed confocal and DIC images from a P30 saccule. The area with a frame is presented in panel D with higher magnification. (D) Superimposed confocal and DIC images (63 × lens) of phalloidin-labeled stereocilia bundles of saccular hair cells. Otoconia can also been seen. Scala bar: 10 μm.

