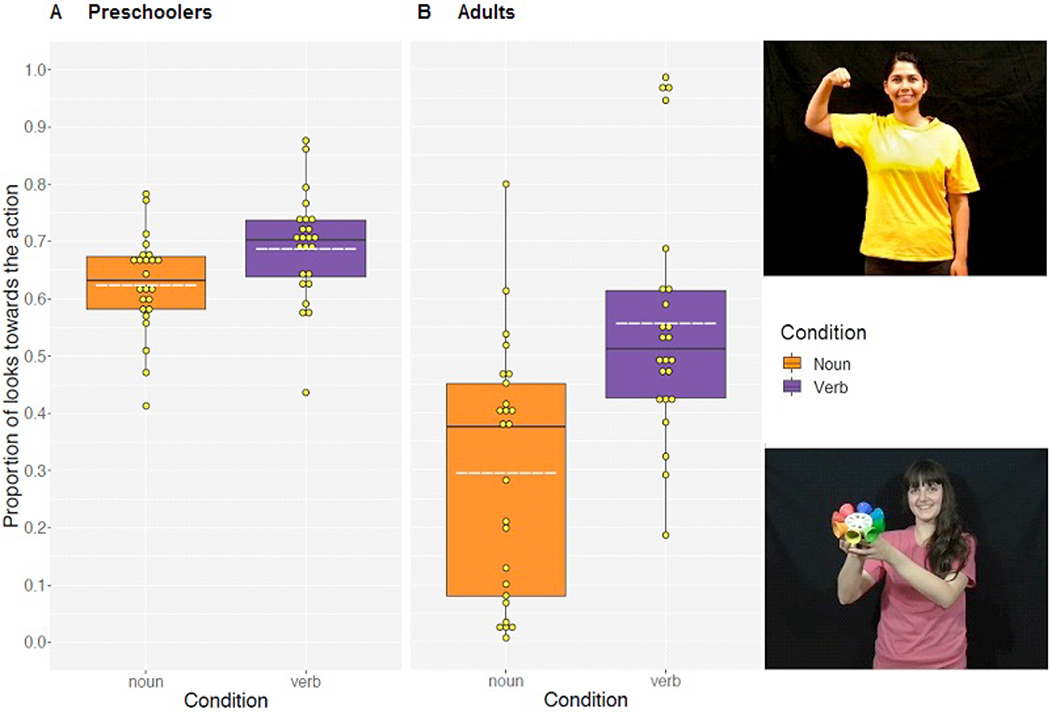
Figure 4.
Preschoolers’ (a) and adults’ (b) mean overall proportion of looks toward the action video in the test phase for the two conditions (Verb Condition in purple and Noun Condition in orange). Yellow dots represent individual participants. The lower and upper hinges correspond to the first and third quartiles, the dotted white lines represent the means, and the black lines within the squares represent the median. The top whiskers denote the maximum value, and the bottom whiskers the minimum value. Note that outliers (one child in the Verb condition and another one in the Noun condition; four adults in the Verb condition) were not removed from any of the reported analyses. For each group, participants from the Verb condition are looking at the action video significantly more than those from the Noun condition.

