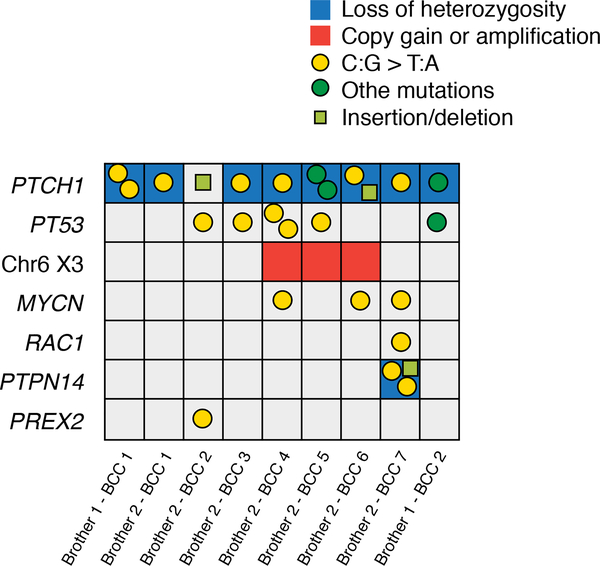
Figure 3: Putative driver mutations and number of somatic events on PTCH1.
Grid diagram displaying putative driver events in the nine studied BCCs. Only damaging mutations and relevant somatic copy number alterations are shown. The left axis lists names of affected genes, the bottom axis individual tumors. Mutation types are defined in the figure legend (right).

