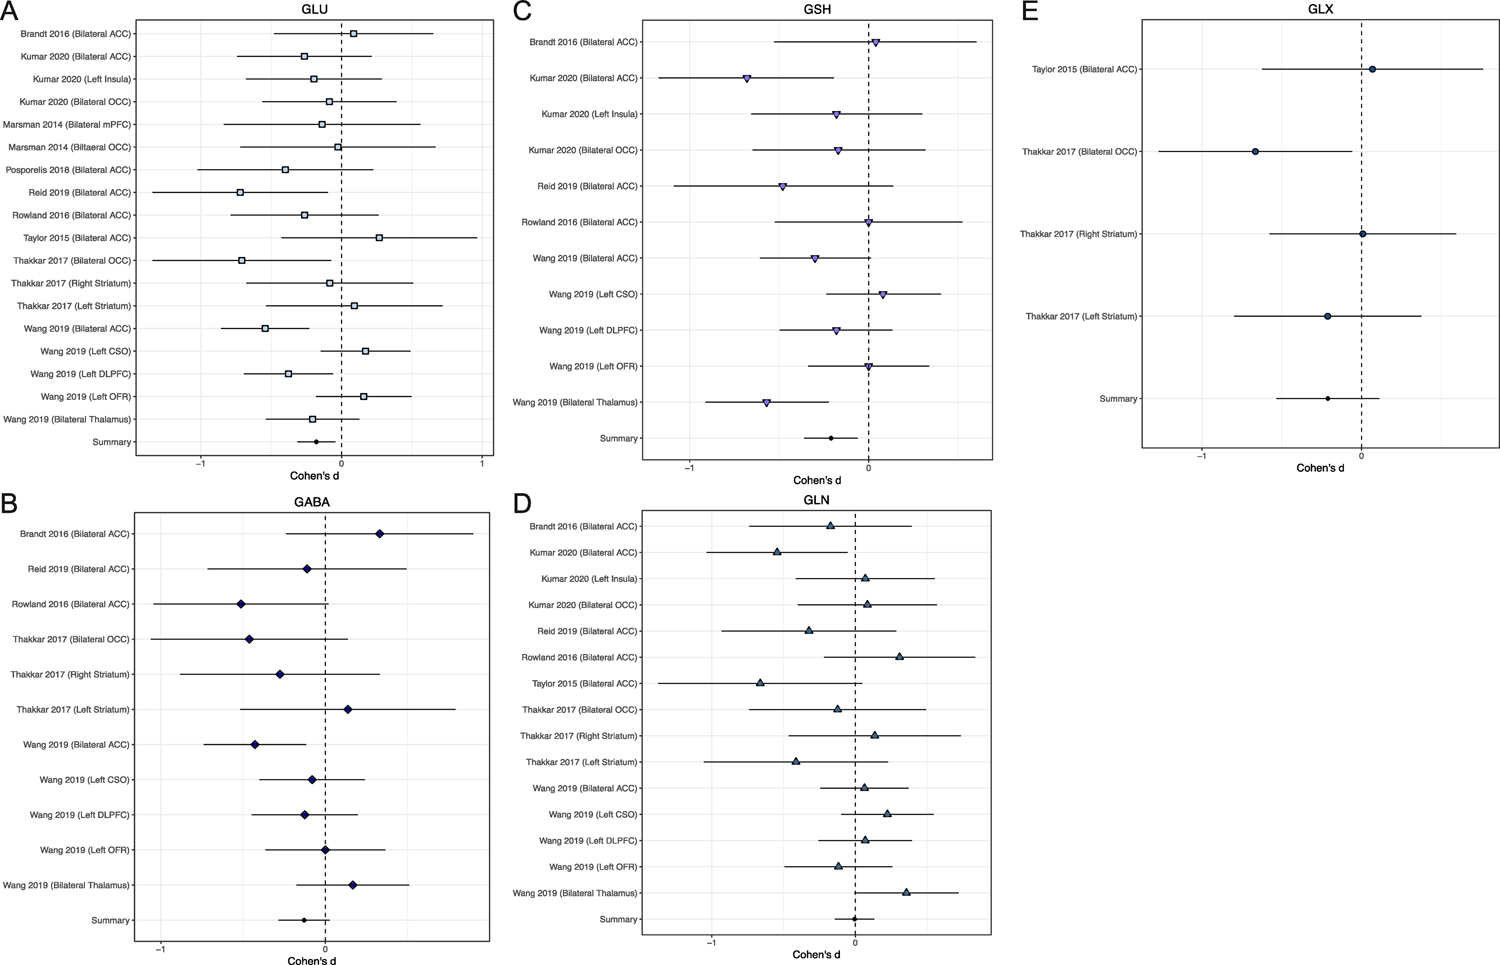
Figure 1.

Study specific effect sizes (Cohen’s D +/− 95% CI) for each neurometabolite: A. Glutamate (Glu), B. Gamma aminobutyric acid (GABA), C. Glutathione (GSH), D. Glutamine (Gln) and E. Glutamate+Glutamine (Glx). Each forest plot displays the study and ROI in which the neurometabolite was measured. A summary effect size is provided for each neurometabolite. Negative effect sizes indicate lower concentration in PSY as compared to HC.
