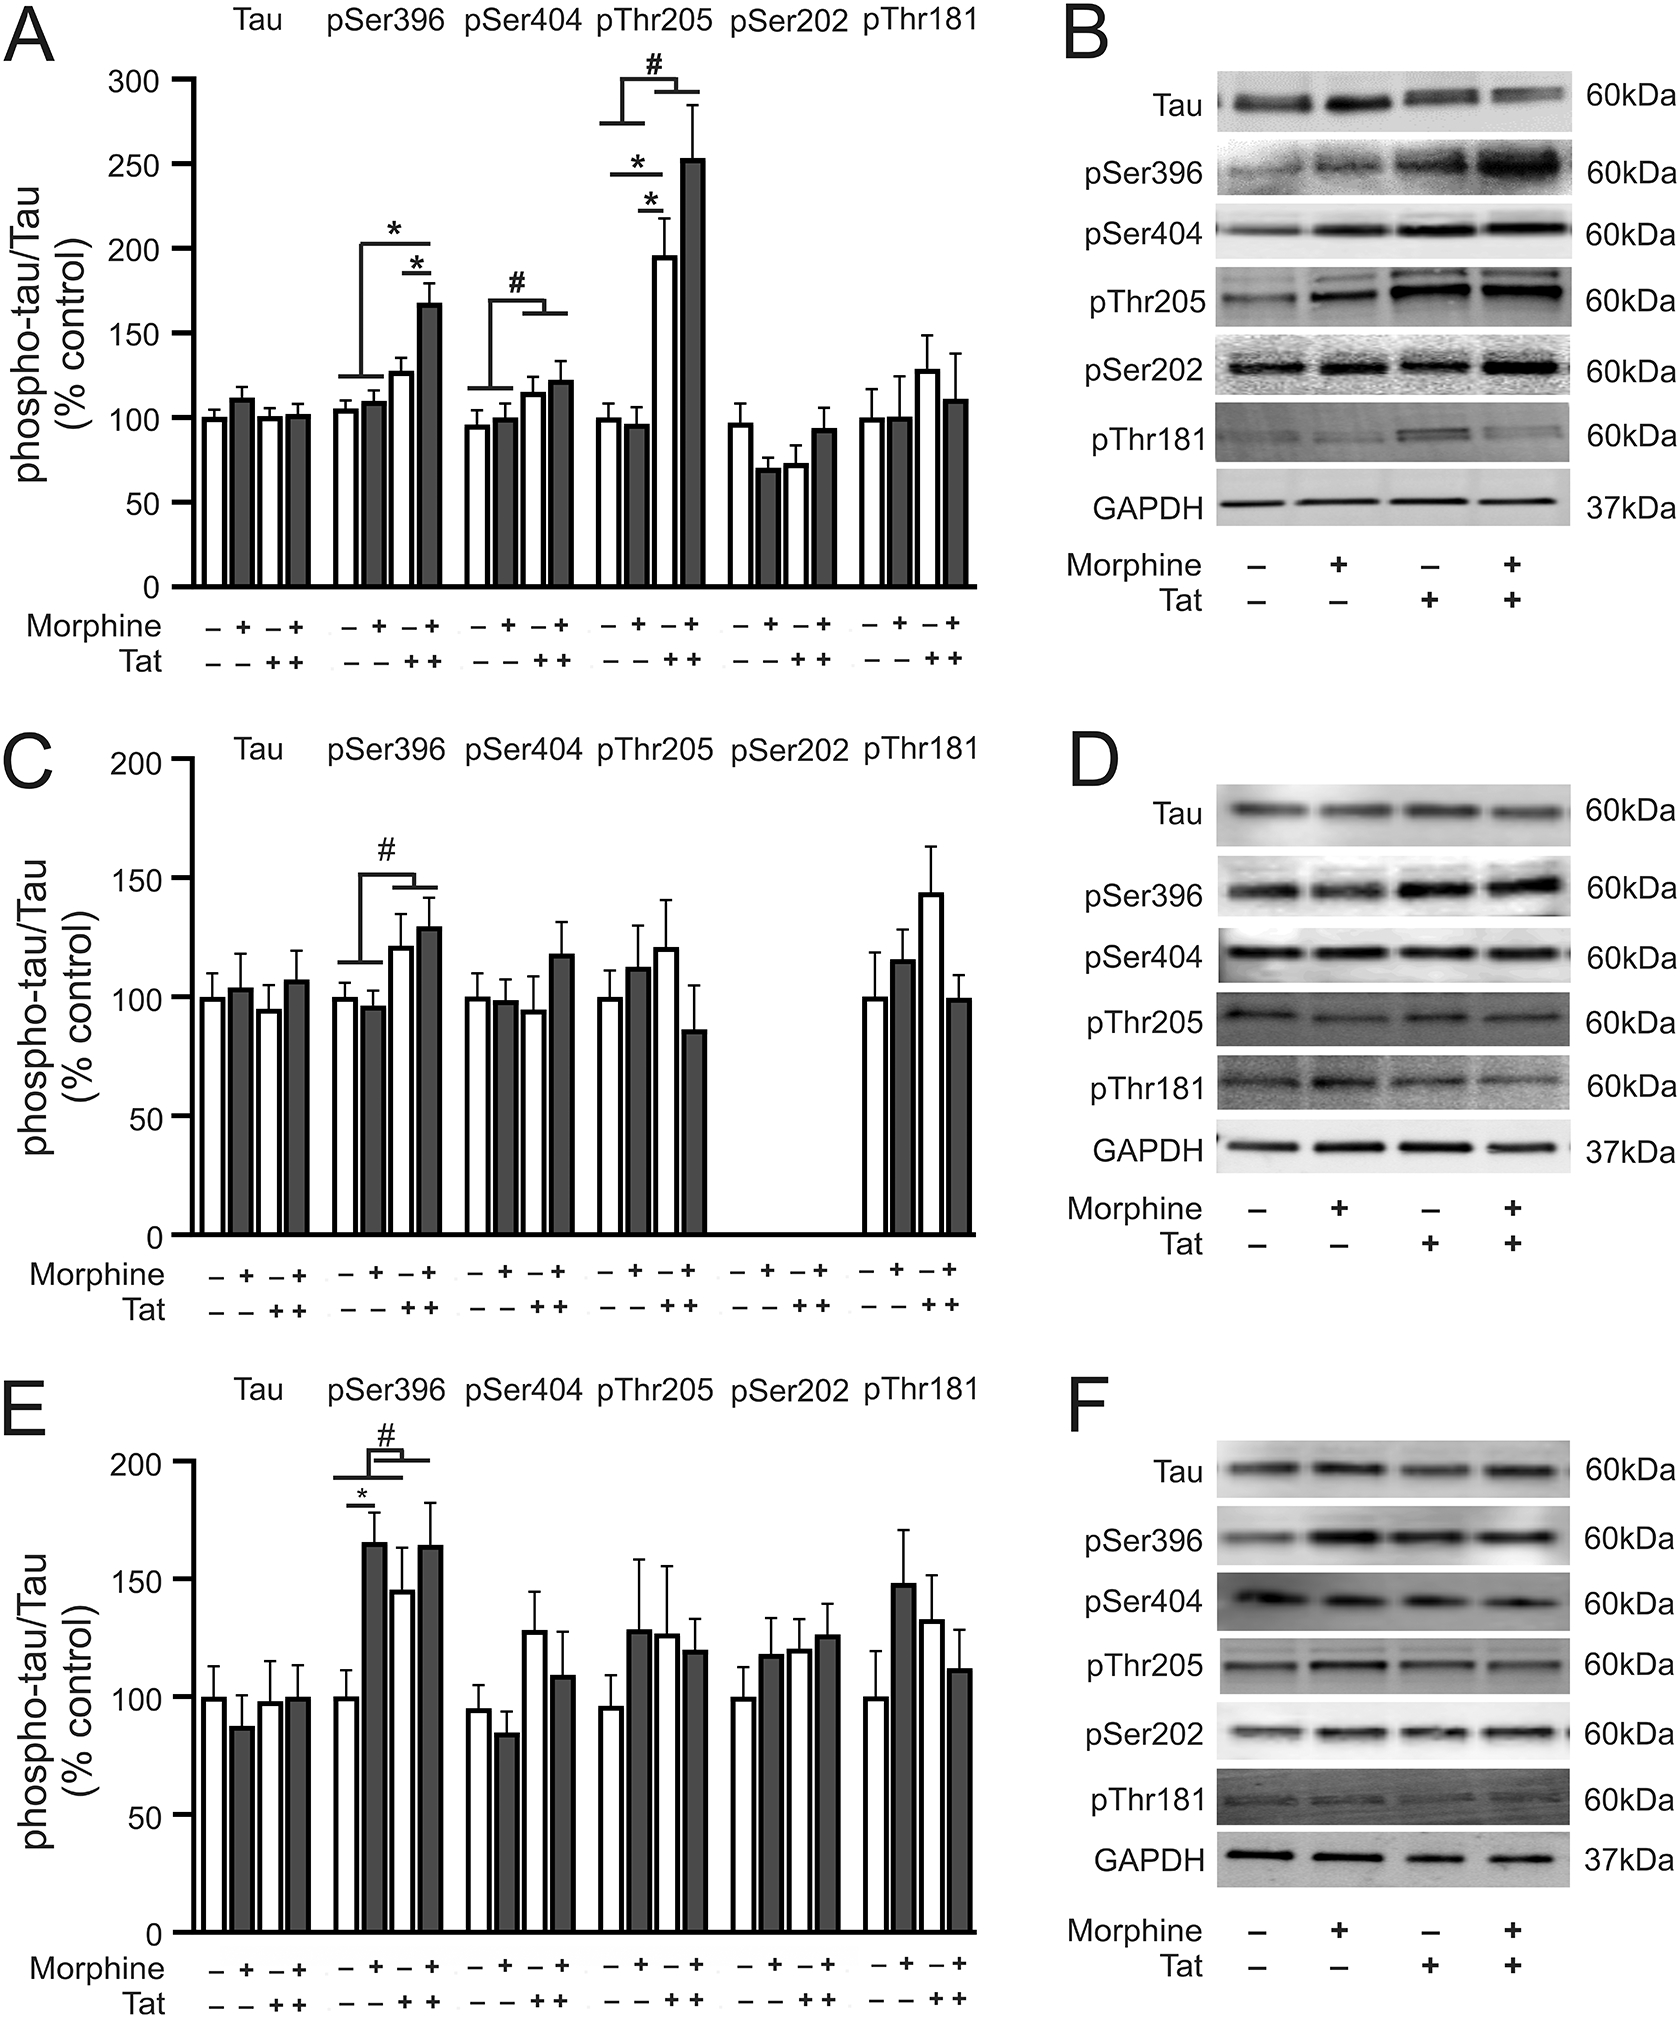
Fig. 3.

Phosphorylated tau protein levels in the striatum, hippocampus, and prefrontal cortex. (A) pSer396 level was increased in the striatum of morphine-treated Tat transgenic mice as compared to all other treatment groups. pSer404 and pThr205 levels were increased in the striatum of Tat transgenic mice irrespective of treatment. Striatal pSer202 and pThr181 levels were unchanged in any of the treatment groups evaluated. (B) Representative immunoblot images of tau, pSer396, pSer404, pThr205, pSer202, pThr181, and GAPDH in the striatum. (C) pSer396 level was increased in the hippocampus of Tat transgenic mice irrespective of treatment. Hippocampal pSer404, pThr205, and pThr181 levels were unchanged in all the treatment groups evaluated. pSer202 level was not detected in the hippocampus. (D) Representative immunoblot images of tau, pSer396, pSer404, pThr205, pThr181, and GAPDH in the hippocampus. (E) Morphine treatment increased pSer396 level in the prefrontal cortex of non-Tat transgenic mice. Prefrontal cortex pSer404, pThr205, pSer202, and pThr181, levels were unchanged in all the treatment groups evaluated. (F) Representative immunoblot images of tau, pSer396, pSer404, pThr205, pSer202, pThr181, and GAPDH in the prefrontal cortex. Data are expressed as the mean ± SEM. # indicates significant main effects by two-way ANOVA. * indicates planned contrasts that showed differences with Tukey’s post hoc test (p < 0.05). p: phosphorylated tau, Ser: serine. n = 6–8/group.
