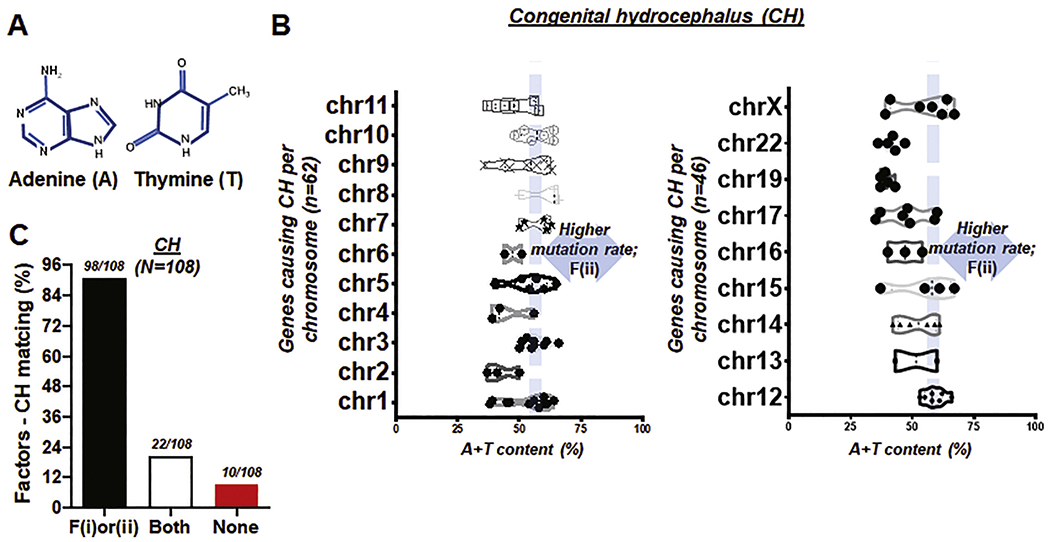
Fig. 3. A + T content of genes and factors-CH matching rate.

(A) Illustration showing two of four chemical bases comprising DNA, adenine (A) and thymine (T) whose combined content is associated with high mutation rate in human chromosomes (Nusbaum et al., 2006). (B) Box and violin plots showing the full distribution of A + T content over chromosome (chr) 1 to 11 (left) and 12 to X (right). F(ii) indicates ‘the second factor or A+T content’ (C) Bar graph demonstrating factors-CH matching rate. ‘F(i)or(ii)’ represents the genes causing CH satisfying either proximity to telomeres within 50 Mbp or A + T content higher than 59%; ‘Both’ represents the genes meeting two factors alike. Total number of genes, N = 108. Matching rate at >90%.
