
Fig. 5. Genes associated with Alzheimer’s disease (AD), satisfying either proximity to telomeres or high A + T content.
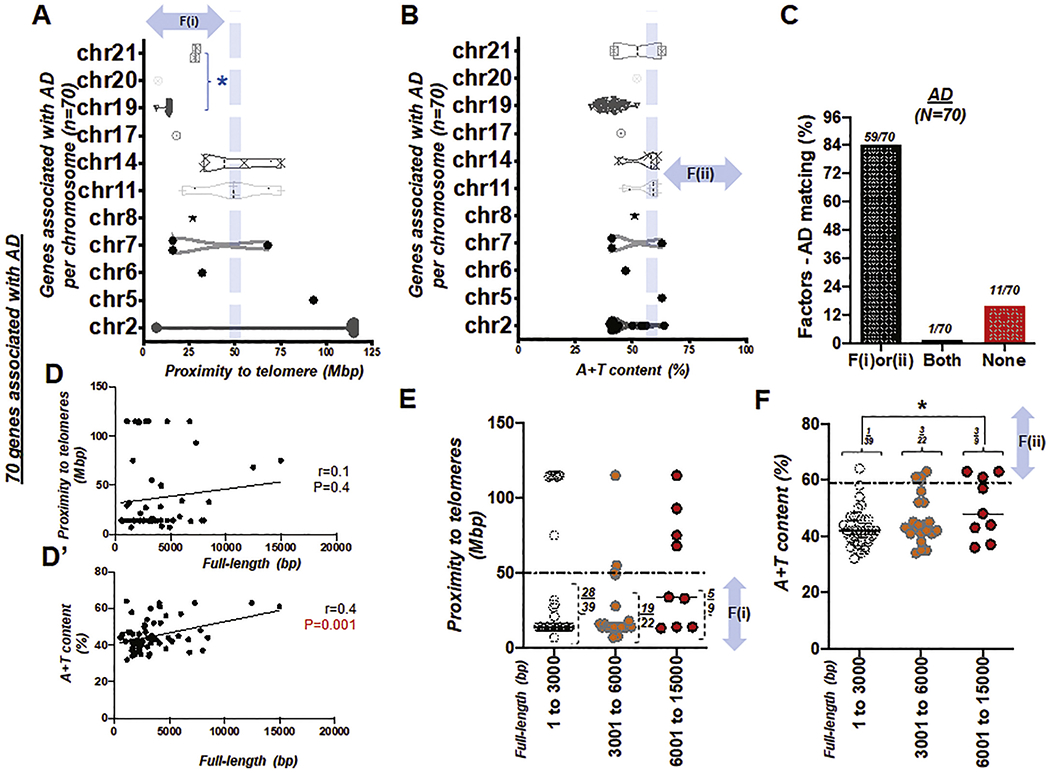
(A) Box and violin plots showing the full distribution of the gene proximity to its telomere over chromosome (chr) 1 to 21. An asterisk in blue, *, indicates ‘the group of chromosomes unlikely to be >50 Mbp distant from the telomere due to their short physical size (Morton, 1991)’ (B) Box and violin plots showing the full distribution of A + T content over chromosome (chr) 1 to 21. (C) Bar graph demonstrating factors-AD matching rate. Total number of genes, N = 70. Success (matching) rate at 84%. (D) Scattered plot showing the Pearson correlation between the full length (bp) of genes associated with AD and proximity to telomeres. (D’) Scattered plot showing the Pearson correlation between the full length (bp) of genes associated with AD and A + T content, r: Pearson coefficient (D-D’). (E) Scattered plot showing 70 genes of AD with proximity to telomeres over full-length size of the gene (bp). A horizontal dotted line indicates 50 Mbp. (F) Scattered plot summarizing 70 genes of AD with A + T content over full-length size of the gene (bp). A horizontal dotted line indicates A + T content at 59%. F(i) and F(ii) indicate the first and second factor, respectively. An asterisk in black, *, P < 0.05.