
Fig. 6. Genes causing fPD and other genetic diseases of the CNS.
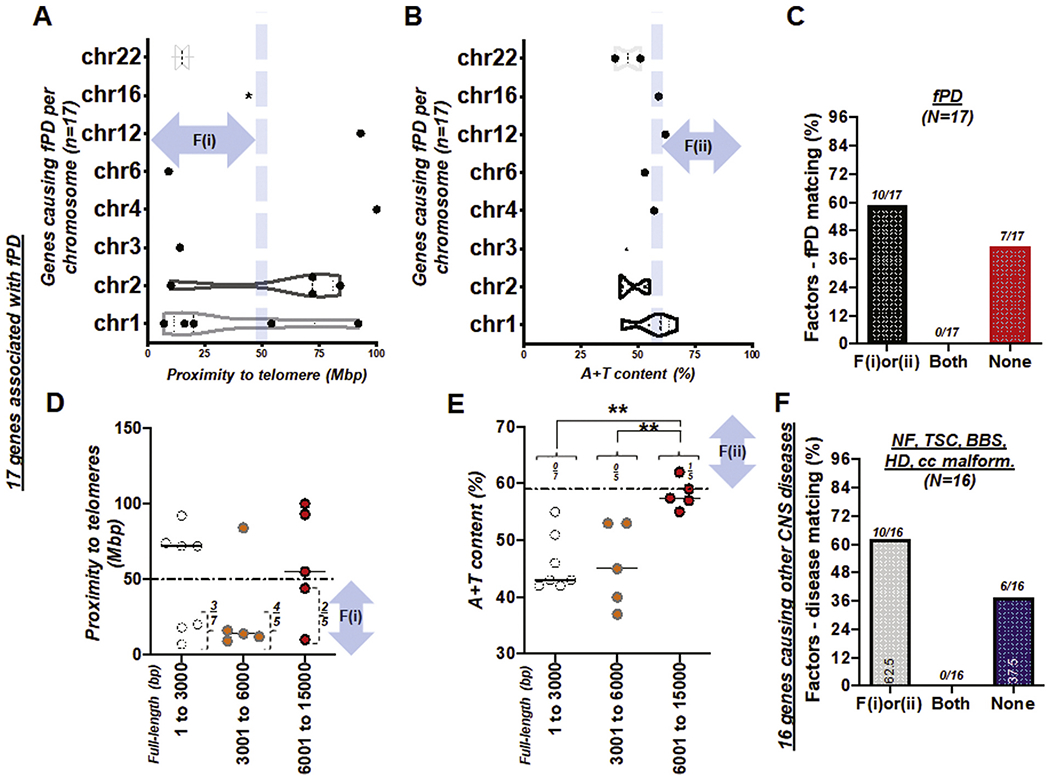
(A) Box and violin plots showing the full distribution of the gene proximity to its telomere over chromosome (chr) 1 to 22. (B) Box and violin plots showing the full distribution of A + T content over chromosome (chr) 1 to 22. fPD: familial Parkinson’s disease (A and B). (C) Bar graph demonstrating factors-fPD matching rate. Total number of genes, N = 17. Success (matching) rate at 59%. See also Table S6. (D) Scattered plot showing 17 genes causing fPD with proximity to telomeres over full-length size of the gene (bp). A horizontal dotted line indicates 50 Mbp. (E) Scattered plot summarizing 17 genes causing fPD with A + T content over full-length size of the gene (bp). A horizontal dotted line indicates A + T content at 59%. F(i) and F(ii) indicate the first and second factor, respectively. **, P < 0.01 (F) Bar graph demonstrating the factor-other diseases of the CNS matching rate. Total number of genes, N = 16. NF; neurofibromatosis (n = 2); TSC; tuberous sclerosis disease (n = 2); BBS (n = 5); HD (n = 1); CNS malformations involving agenesis of corpus callosum (cc; n = 6). Success (matching) rate at ~60%. See also Table S7.