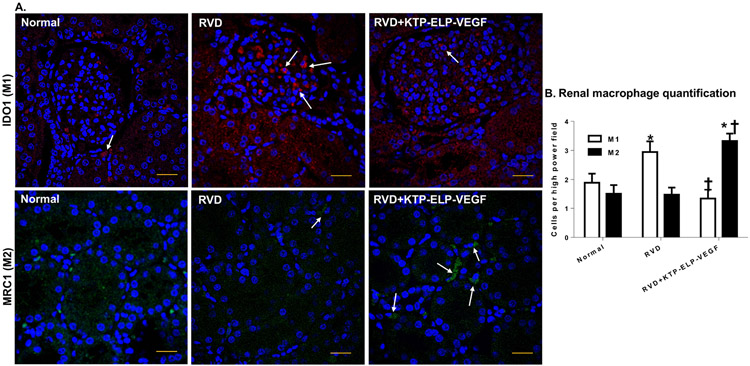
Figure 3.
Representative immunostaining (A) and quantification (B) of M1 and M2 macrophages using the M1 marker indoleamine-2,3-dioxygenase (IDO1, red), the M2 marker mannose receptor c type-1 (MRC1, green), and the nuclear counterstain DAPI (blue) in normal, RVD, and RVD+KTP-ELP-VEGF pigs after 10 weeks of observation. Untreated RVD pigs showed significantly increased macrophage infiltration which was markedly skewed towards inflammatory M1 polarization. Pigs treated with KTP-ELP-VEGF showed similar overall macrophage infiltration which was shifted in favor of anti-inflammatory M2s. Scale bar represents 20 μm. n=6 per group. *p<0.05 vs. normal; † p<0.05 vs. RVD (Single way ANOVA, Tukey).

