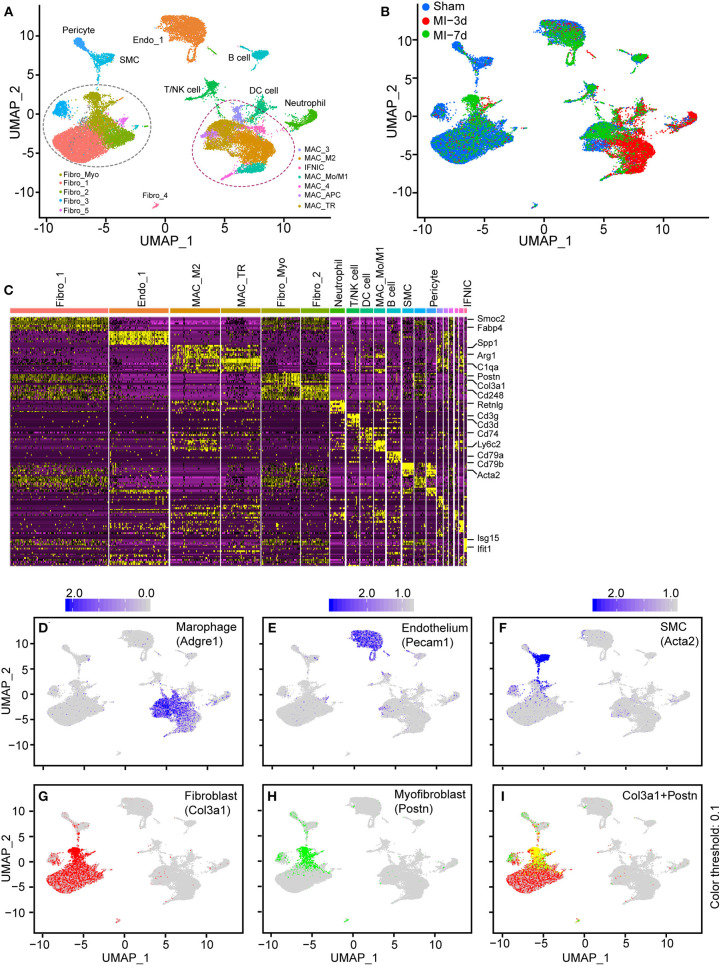
Figure 1.
Integration of non-cardiomyocytes (non-CMs) in healthy and nonhealthy hearts. (A) UMAP plot of non-CMs from the sham group or 3 and 7 days after myocardial infarction (MI), showing the construction of 20 subpopulations in different colors. (B) UMAP plot of integrated non-CMs under different conditions shown in different colors. (C) Heatmap of 20 subclusters with differentially expressed genes across cell populations for cell identification, in which the upper bars refer to subclusters. (D–I) UMAP visualization of all cells, combined with the expression of Adgre1 (D), Pecam1 (E), Acta2 (F), Col3a1 (G), and Postn (H,I). The scaled expression of target genes were indicated in the upper portion of each panel.

