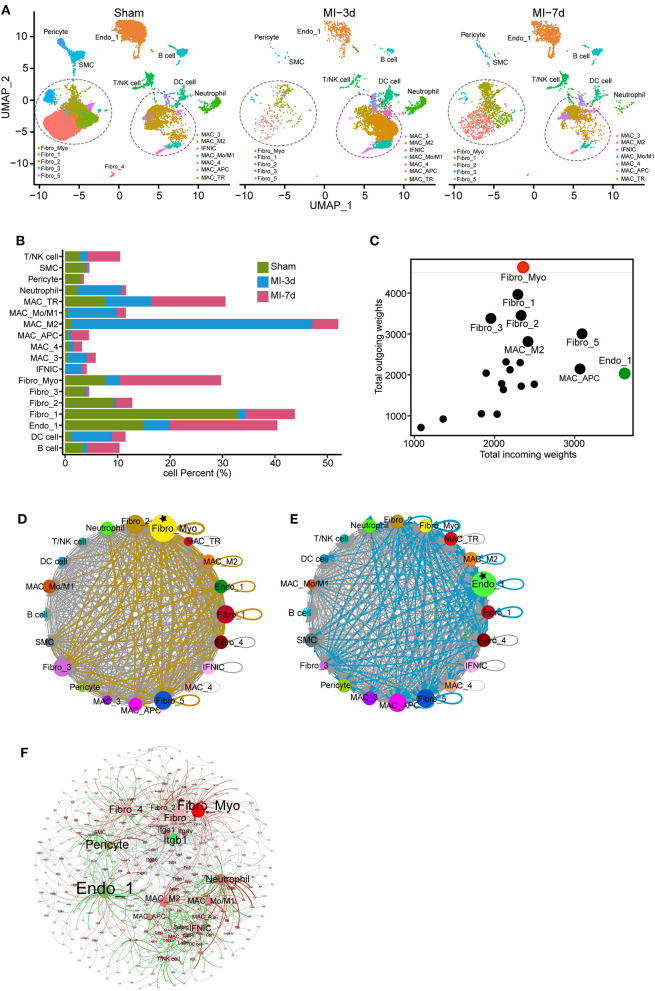
Figure 2.
Dynamics and cell communication of non-cardiomyocytes (non-CMs). (A) Separated UMAP plots showing heterogeneous non-CM populations in the sham group, 3 and 7 days after myocardial infarction (MI). Fibroblasts (FBs) and macrophages were circled with dashed lines. (B) Bar plot showing the dynamics of cell clusters in sham and MI hearts. (C) Cell communication across all subpopulations was identified with well-characterized ligand-receptor pairs. Outcoming and incoming weights refer to the weighted numbers of ligands and receptors among all cell populations. (D,E) Putative cell communication based on differentially expressed ligands (D) and receptors (E) including total cell clusters. Circular compartments representing subclusters with weighted sizes. (F) Putative cell-cell interactions, including cell types, ligands, and receptors. All interactions of ligands from source cell populations to receptors (target populations) were plotted; cell type, ligands, and receptors were filled as nodes; and interactions were shown as edges. The source data were uploaded as Supplementary Table III.

